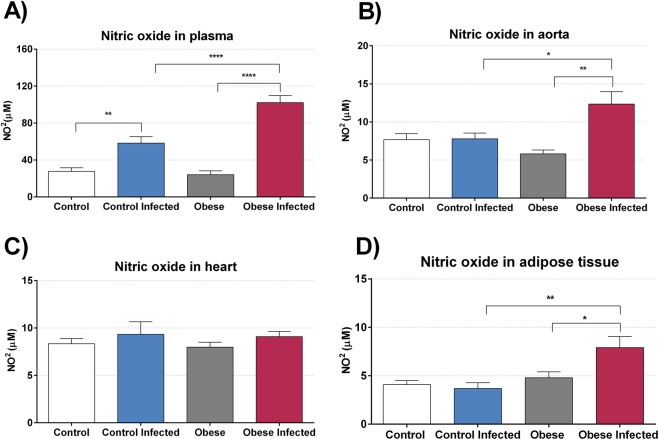
Figure 7.
Obesity modulate nitric oxide production. The nitric oxide (NO) was estimated by production of nitrite through cadmium/Griess technique and was measured in plasma (A), aorta (B), heart tissue (C) and adipose tissue from retroperitoneal region (D) on 13th day post infection. The levels of NO were expressed in NO micromolar (NO2µM). Bars represent mean ± SEM of eight mice per group. *p < 0.05, **p < 0.01, ***p < 0.001 and ****p < 0.0001 when compared between groups.

