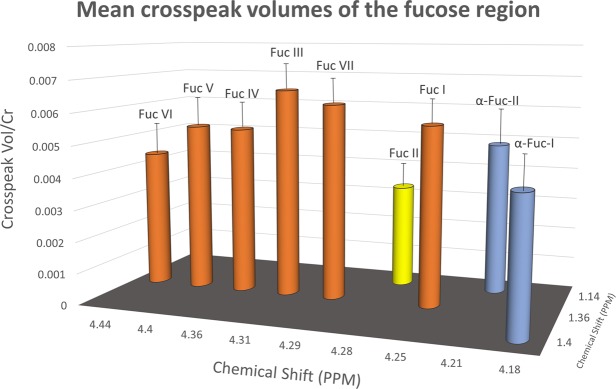
Figure 4.
This is a schematic representation of the chemical shifts for each of the seven fucosylated glycan and substrate α-L-fucose crosspeaks. The mean crosspeak volume for all thirty-three healthy volunteers. Fuc I, IV, III, IV, V and VI (in orange) all resonate at 1.36 ppm on the F1 axis but differ in F2. The Fuc II crosspeak (Yellow) is at 1.14 ppm in F1 and is reproducibly smaller than all the other crosspeaks. The α-L-fucose substrate crosspeaks are not present in 10 out of 33 of the healthy controls but are included in Fig. 4 as the mean average from the 23 times they were present.

