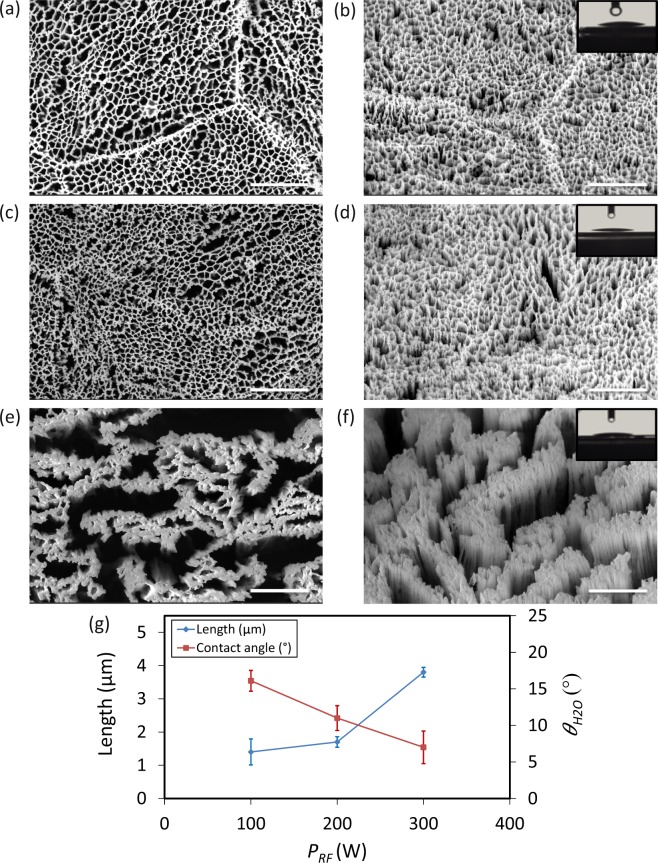
Figure 3.
SEM micrographs of the Ti nanostructures created using different values of RF power: (a,b) 100 W, (c,d) 200 W, (e,f) 300 W. The left sub-figures were taken from the top view while the right sub-figures were taken at 35° tilted view. Other etching conditions: Δt 20 min, Cl2 30 sccm, Ar 2.5 sccm, T 20 °C, p 0.02 mbar and PICP 600 W. Insets show a droplet of water on the black Ti surface. The scale bar is 1 µm. (g) The length and wettability of the Ti nanostructures as a function of PRF.

