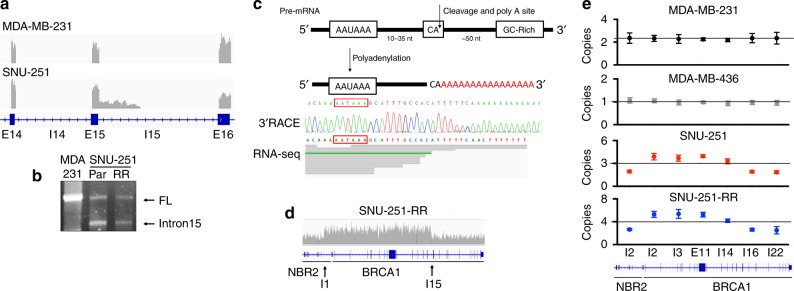
Fig. 2. Intronic polyadenylation occurs in SNU-251 cells.
a Integrative Genomics Viewer (IGV) showing BRCA1 exons 14–16 reads detected using RNA-seq in MDA-MB-231 and SNU-251-RR cells. b Identification of BRCA1 transcripts by 3′ RACE. Representative gel image indicating BRCA1 full-length (FL) and intron 15 transcripts. c Cartoon showing a consensus AAUAAA polyadenylation signal that is followed by a CA cleavage and polyadenylation site 10–35 nucleotides downstream. Below, Sanger sequencing of BRCA1 intron 15 mRNA identified by 3′RACE, polyadenylation sequence is highlighted. The corresponding 3′ reads detected by RNA-seq are shown for comparison. d IGV of SNU-251-RR WGS reads detected mapping to chromosome 17 NBR2 and BRCA1 gene locations. e Cells were assessed for genomic copy number using q-PCR at NBR2 intron 2, BRCA1 intron 2, intron 3, exon 11, intron 14, intron 16 and intron 22. Copy number is normalized to the signal detected in RPE nontransformed cells (n = 2 copy number). Line shows the mean copy number for all reactions in each cell line. Data are the mean ± SD of n = 3 biological replicates.

