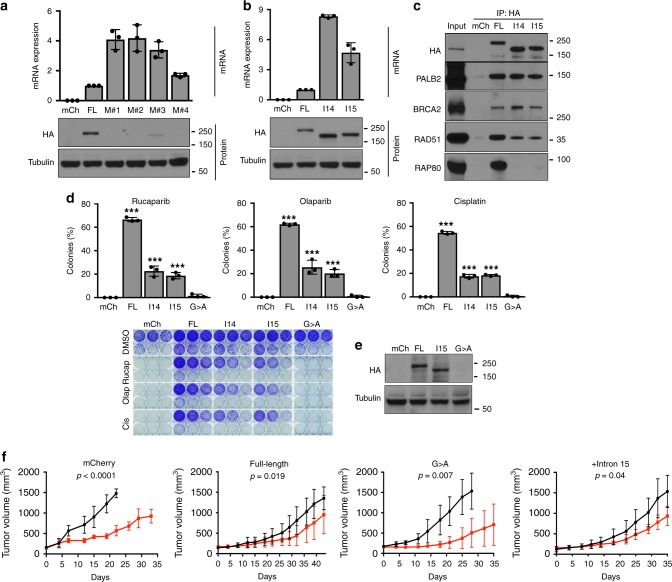
Fig. 5. BRCA1-I15 is stable and hypomorphic.
a MDA-MB-436 cells engineered to express mCherry (mCh), HA-BRCA1 full-length/wild-type (FL), or the HA-BRCA1 BRCT mutations (M) c.5251 C > T-(M#1), c.5263insC-(M#2), c.5277insTA-(M#3), c.5445 G > A-(M#4), that are endogenously present in HCC1395, HCC1937, MDA-MB-436 and SNU-251 BRCA1 BRCT mutant cell lines, respectively; and were assessed for HA mRNA by qRT-PCR. HA expression normalized to FL expressing cells is shown (above). HA protein expression was assessed from the same cells by Western blotting (below). b MDA-MB-436 cells engineered to express mCh, BRCA1-FL, BRCA1-I14-(I14), and BRCA1-I15-(I15) were assessed as described in a. See Supplementary Fig. 4b. c Cells from panel b were subject to HA-immunoprecipitation with the indicated antibodies. d mCh, BRCA1-FL, BRCA1–14, BRCA1-I15, and BRCA1 c.5445 G > A (SNU-251 mutation) expressing MDA-MB-436 cells were seeded at decreasing densities in the presence of 20 nM rucaparib, 20 nM olaparib or 20 ng/ml cisplatin and assessed for colony formation. ***p < 0.001 compared to mCh cells. Below, representative plates. For panels a−d, data are the mean ± SD of n = 3 biological replicates. Statistical significance was assessed by unpaired, two-tailed t tests. e mCh, BRCA1-FL, BRCA1-I15, and BRCA1 c.5445 G > A expressing MDA-MB-436 tumor xenografts were harvested and assessed for HA expression by Western blotting. f Mice harboring mCh, BRCA1-FL, BRCA1-I15, and BRCA1 c.5445 G > A expressing MDA-MB-436 tumor xenografts were treated with vehicle (black line) or 200 mg/kg rucaparib bi-daily (red line) for 2 × 5 days with a 2-day interval. Mean ± SD. Tumor volumes are shown for five tumors implanted in five separate mice per cell line per treatment from the same experiment. A linear mixed effects model tested the difference in slopes of log- tumor volume, and p values shown are tests of differences in growth rates between vehicle and rucaparib-treated tumors. Moreover, differences-in-slopes (i.e. vehicle to PARPi differences) were compared using Tukey’s correction for multiple comparisons: BRCA1 5445 G > A vs. BRCA1-I15 (p = 0.02), BRCA1 5445 G > A vs. BRCA1-FL (p < 0.001), BRCA1-I15 vs. mCh (p = 0.04), and mCh vs. BRCA1-FL (p = 0.001), 5445 G > A vs. mCh (p = 0.99) or BRCA1-I15 vs. BRCA1-FL (p = 0.57). See Supplementary Data 1 file for more details.

