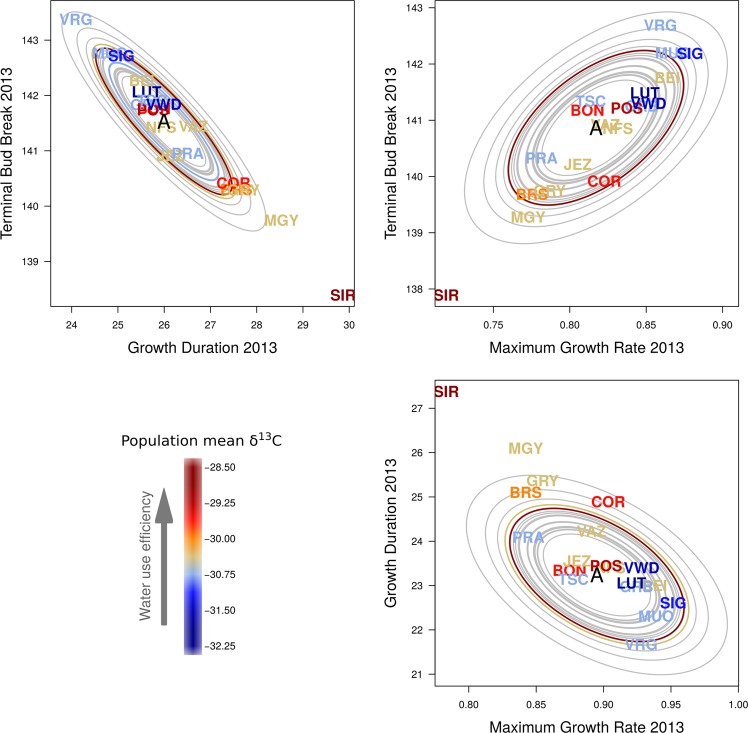
Fig. 4.
Correlated adaptive divergence in a two-trait space between Terminal Bud Break, Growth Duration and Maximum Growth Rate. Colors indicate a proxy for water use efficiency, mean δ13C of ten adult trees per population. Less negative δ13C indicate higher water use efficiency. The capital letter A in the middle of the ellipses indicates the estimated ancestral additive mean trait value. Ellipses represent the median amount of trait divergence that is expected based on drift for each population (null hypothesis). Population codes (3 letters) represent the median of the posterior distribution of the additive trait values for each population. Populations with strong evidence of selection using the S-test are highlighted with an ellipse in color (identical to that of the population code). Ellipses of populations that do not deviate from drift are shown in gray

