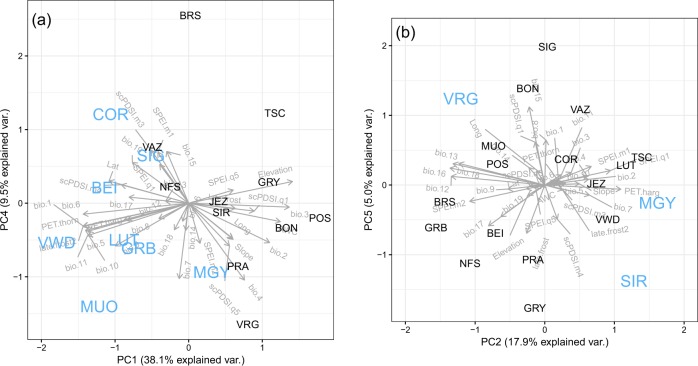
Fig. 5.
Principal component (PC) analysis of the environmental variables listed in Table 1 with populations (three letter codes) highlighted in blue if they showed evidence of selection in the S-tests for 2013 or 2014 Height (a) and for Terminal Bud Break, Maximum Growth Rate and Duration (b). Each panel shows the environmental space with the first two PC axes that had explained the highest amount of variance using the H*-test, which were PC 1 and 4 for 2013 or 2014 Height, and PCs 2 and 5 for Bud Break and Growth Duration

