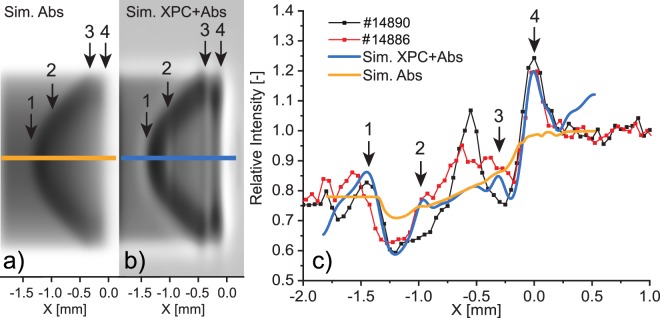
Figure 7.
Simulated images of a shock-wave using the experimental parameters as input; (a) (Sim.Abs) shows only the absorption contribution, (b) (Sim. XPC + Abs) shows the XPC-effect in addition to the absorption contribution. The greys scales are different in the two images, the background (vacuum) has the same values in the two images. (c) Simulated profile along the object axis (blue and yellow line) superimposed to the experimental values (shots #14890, #14886). The scatter-point lines are calculated from a 10-pixel average along the object axis as indicated by the red box in Fig. 5. The black arrows (number 1–4) point toward features that are clearly visible in the experimental images and in the XPCI simulation but not in the absorption one.

