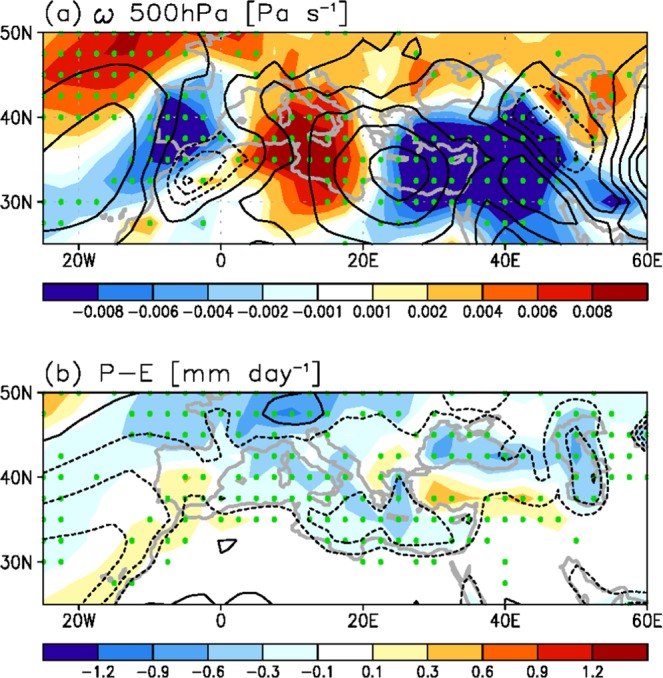
Figure 1.

Multi-model ensemble-mean descending motion and P-E for climatology and future change during summer. (a) Spatial pattern of 500-hPa omega climatology (black contour; Pa s−1) and future change (shading; Pa s−1) for the seven-model ensemble-mean in boreal summer. (b) The same as in (a) but for the P-E (mm day−1). The contour intervals are 0.02 Pa s−1 in (a) and 1 mm day−1 in (b). Green dots in (a,b) indicate the points where more than 85% of the models agree on the sign of the mean for future change. In (a,b) maps were generated by GrADS version 1.9b4 (http://grads.iges.org/grads/).
