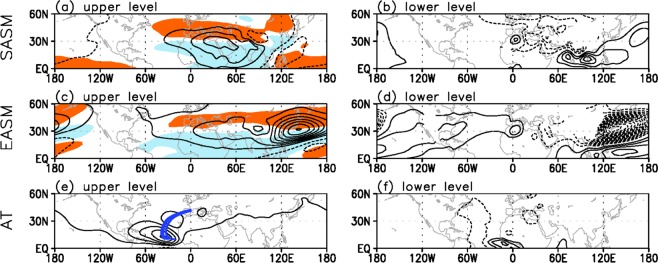
Figure 3.
Simulated upper- and lower-level circulation anomalies in response to each forcing. Upper (σ = 0.230) and lower troposphere (σ = 0.950) streamfunction anomalies (contour; m2 s−1) averaged over 25–29 days for the (a,b) SASM, (c,d) EASM, and (e,f) Atlantic experiments. The intervals of streamfunction anomalies are in (a,c) 1.2 × 10⁶ m2 s−1, (b,d) 0.2 × 10⁶ m2 s−1, (e) 0.5 × 10⁶ m2 s−1, and (f) 0.15 × 10⁶ m2 s−1. Orange (sky blue) shading in (a,c) indicates the upper-level zonal wind anomaly greater (less) than 0.5 (–0.5) m s−1. Blue lines denote the Rossby wave ray path for waves with the zonal wavenumber 5. Maps were generated using GrADS version 1.9b4 (http://grads.iges.org/grads/).

