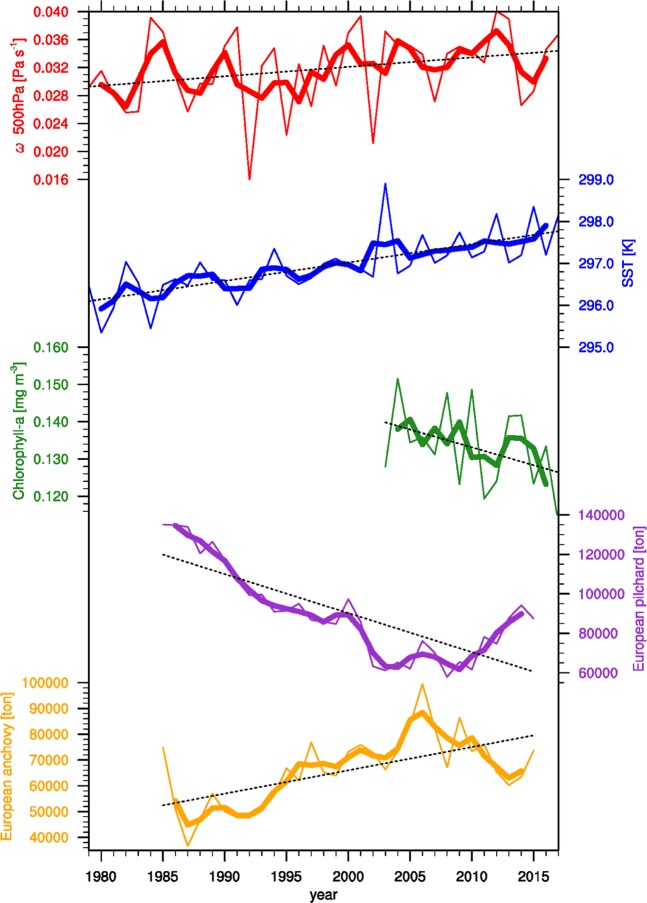
Figure 4.
Observed global warming effects on the western Mediterranean. Time series of the summer-mean subsidence during 1979–2017 from the ERA-Interim (red line, Pa s−1, positive 500-hPa omega indicates the descending motion), the SST from the ERSSTv5 (blue line, K), the chlorophyll-a from the MODIS (green line, mg m−3), and the annual captured fisheries of European pilchard and anchovy from the FAO GMFC (purple and yellow lines, ton). Thin lines indicate the yearly value and thick lines denote the three-year running mean. Dotted black lines represent the best linear fit to time series of each variable.

