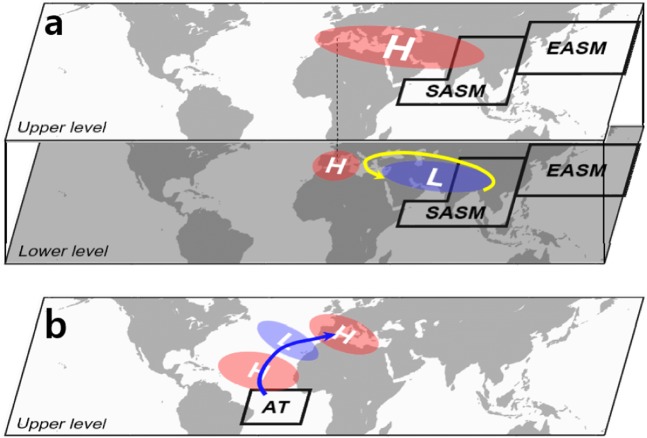
Figure 5.
Remote control mechanisms for the heating over the western Mediterranean. Schematic illustrating the (a) monsoon–desert teleconnection and (b) northeastward wave energy propagation. Red (blue) shading ellipses indicate the anticyclonic (cyclonic) circulation. Black line boxes show the SASM, EASM, and Atlantic forcings. The Gill-type Rossby wave response to the SASM and EASM forcings is denoted by yellow line in (a) and the northeastward wave route emanated from the Atlantic forcing is shown as blue line in (b). The maps were created using the NCAR Command Language Version 6.4.0 (http://www.ncl.ucar.edu).

