Fig. 4.
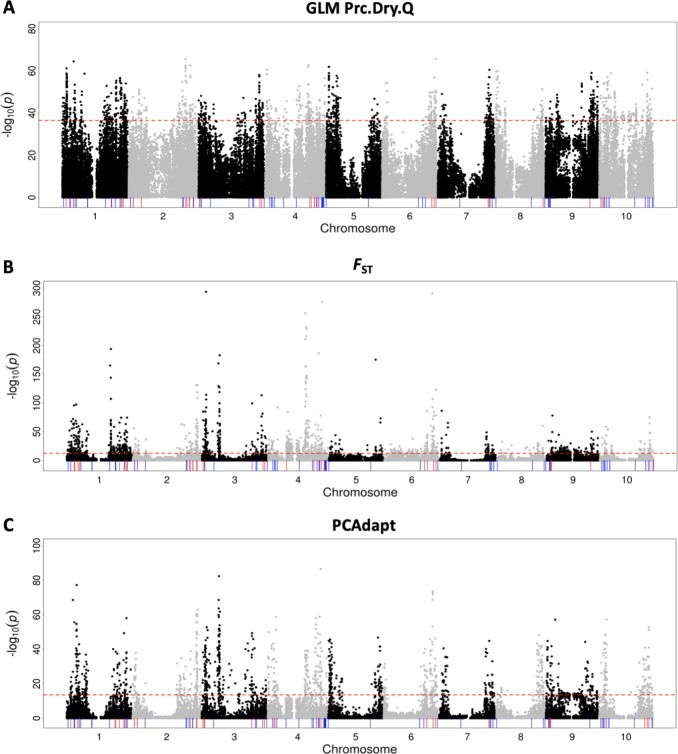
Genome-wide scans for adaptation. Negative log10-transformed P-values from the genome-wide SNP scans are plotted against the genome position for a GLM association with precipitation in the driest quarter (Prc.Dry.Q), b SNMF-based FST, and c PCAdapt using K = 10. Red horizontal dashed line indicates the genome-wide threshold of the top 1% outlier SNPs for association with Prc.Dry.Q (−log10(p) = 36.5), SNMF-based FST (−log10(p) = 12.5) and PCAdapt (−log10(p) = 13.5). Red vertical lines represent a priori candidate genes of seed mass above the given thresholds for association with Prc.Dry.Q (n = 36), SNMF-based FST (n = 35), and PCAdapt (n = 37). Blue vertical segments indicate the undetected 64, 65, and 63 a priori candidate genes of seed mass below the thresholds for association with Prc.Dry.Q, SNMF-based FST, and PCAdapt, respectively

