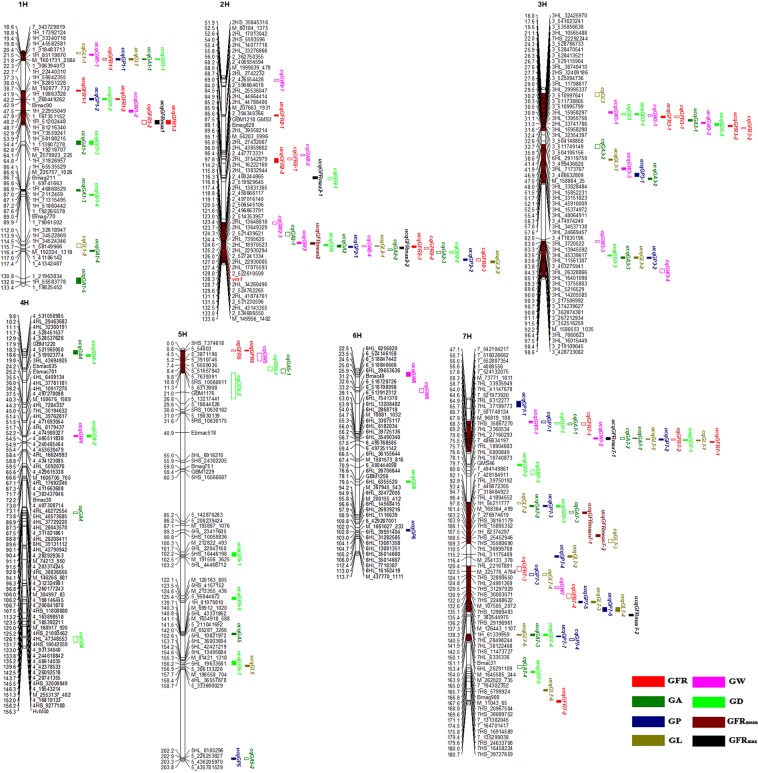
Figure 3.
Chromosomes location of the consensus QTLs associated with GFR, GFRmean, GFRmax and five grain size traits. The marker names are listed on the right of the linkage groups, and the positions on the left, given in centimorgan (cM). Solid and hollow bars represent the QTLs that were mapped using unconditional and conditional methods, respectively, the brown area on the linkage groups represents the QTL cluster. Abbreviations are shown in the footnote of Table 1.

