FIGURE 4.

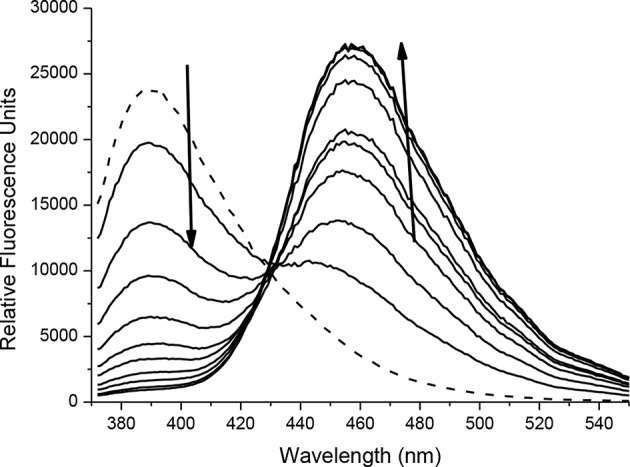
Fluorescence spectra of 6 (10 μM) in the presence of ONOO− (0, 2, 4, 6, 8, 10, 12, 14, 16, 18, 20 μM). The data was collected in PBS buffer, pH = 7.3 at 25°C where λex = 345 (16 bandwidth) nm. The dotted line represents probe only.

Fluorescence spectra of 6 (10 μM) in the presence of ONOO− (0, 2, 4, 6, 8, 10, 12, 14, 16, 18, 20 μM). The data was collected in PBS buffer, pH = 7.3 at 25°C where λex = 345 (16 bandwidth) nm. The dotted line represents probe only.