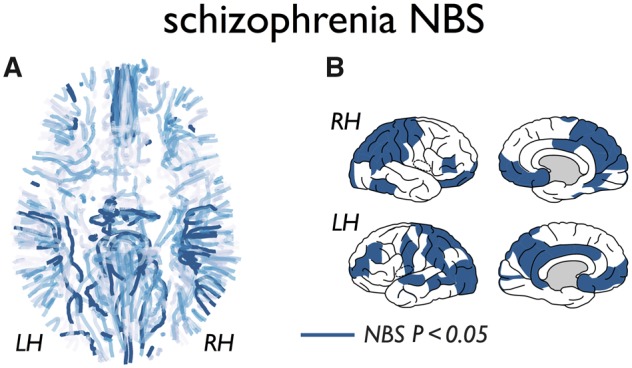
Figure 1.

Schizophrenia dysconnectivity. (A) The cortico-cortical fibre connections of the group average human connectome (group threshold 60%) with level of dysconnectivity (fractional anisotropy weighted) as measured between n = 48 schizophrenia patients and n = 43 matched healthy control subjects. Dysconnectivity levels are indicated from light blue (no patient-control difference) to dark blue (patients showing significantly lower fractional anisotropy than controls) NBS, P = 0.024. (B) Cortical regions involved in the NBS subnetwork showing significantly reduced white matter connectivity in patients.
