Figure 3.
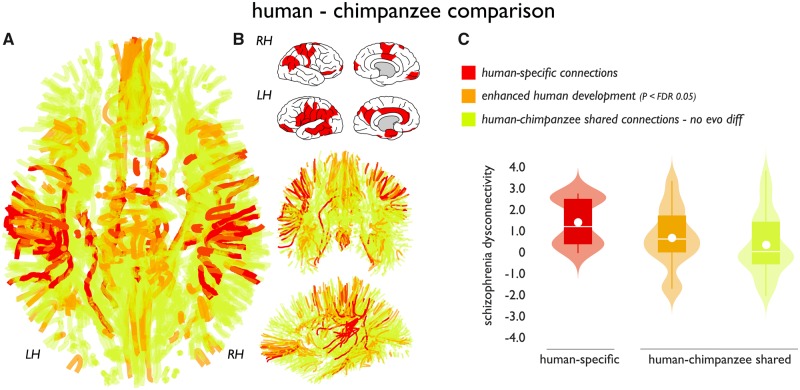
Human-specific connections and association to disease. (A) Identified cortico-cortical connections of the human cerebral connectome. Red connections identify human-specific connections, orange connections show human-chimpanzee shared connections showing significant positive human enhancement (normalized fractional anisotropy, P < 0.05 FDR). Green connections indicate remaining human-chimpanzee shared connections showing no species difference and connections of the group average connectome. (B) Subset of cortical regions that displayed one or more human-specific cortico-cortical connections. (C) Schizophrenia effects (y-axis: t-statistic of fractional anisotropy values controls versus patients) across human-specific (red) and connections shared between humans and chimpanzees. Effects in shared connections were further decomposed into connections showing enhanced human development as compared to chimpanzees (chimpanzee-human difference FDR P < 0.05) and connections that showed no positive difference in normalized fractional anisotropy between chimpanzees and humans (P > 0.05). Human-specific connections showed the largest effect, with human enhanced connections in second place (Jonckheere-Terpstra P = 0.002). Boxes display the interval between 25th and 75th percentiles (q1 and q3); white lines indicate median values, white circles indicate mean values; whiskers indicate the interval between q1−1.5×(q3−q1) and q3+1.5×(q3−q1); violin plots show the distribution of values (smoothed for visualization with a 0.4 kernel).

