Figure 1.
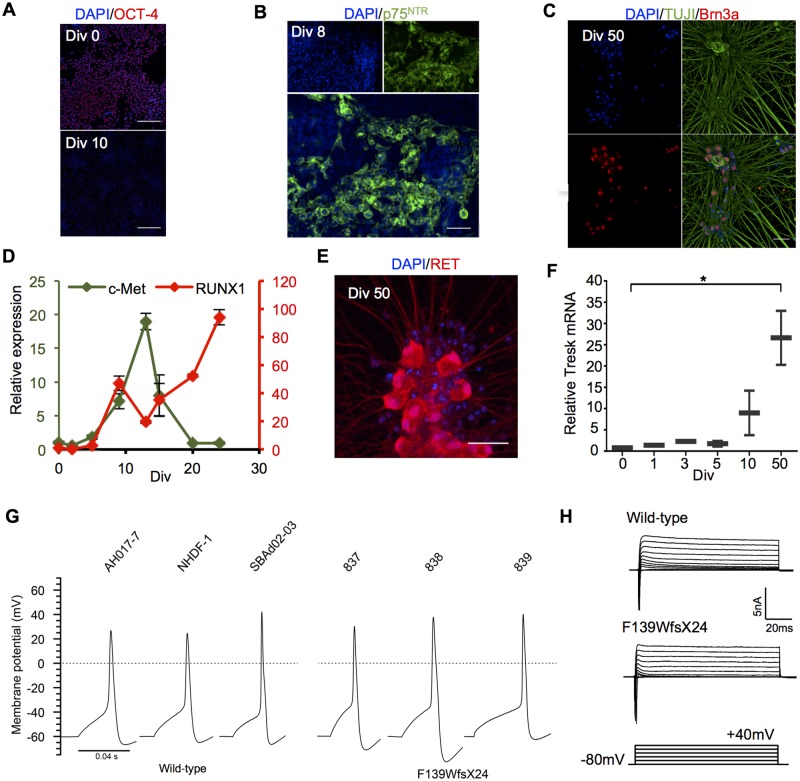
Differentiation of nociceptors from iPSCs. (A) Representative image of iPSC line losing the pluripotency marker, OCT-4 expression during nociceptor differentiation. Scale bar = 200 µm. (B) Widespread protein expression of the neural crest marker p75(NTR) at Day 8. (C) Representative images illustrating the presence of neuronal (TUJ1) and sensory (Brn3a) markers in mature neurons after 50 days in culture. (D) Quantitative RT-PCR analysis indicates a progressive increase in RUNX1 expression with a corresponding decline in MET/c-Met indicating acquisition of non-peptidergic nociceptor fate. Gene expression levels were normalized to GAPDH and are presented as values relative to a sample of undifferentiated iPSC (i.e. Day 0). (E) Expression of the non-peptidergic marker, RET, in mature neurons. (F) RT-qPCR detection of KCNK18 (TRESK) mRNA transcript level increases as nociceptors mature (*P > 0 .05, one‐way ANOVA). GAPDH expression was used as a housekeeping gene to normalize expression levels. (G) Whole cell recording of single action potentials can be evoked reliably in both control nociceptors and F139WfsX24 nociceptor lines. (H) Representative voltage clamp data showing inward and outward currents recorded during step membrane depolarization of control wild-type (AH017-7) and F139WfsX2 (839) nociceptors. Unless otherwise stated, scale bars = 50 μm.

