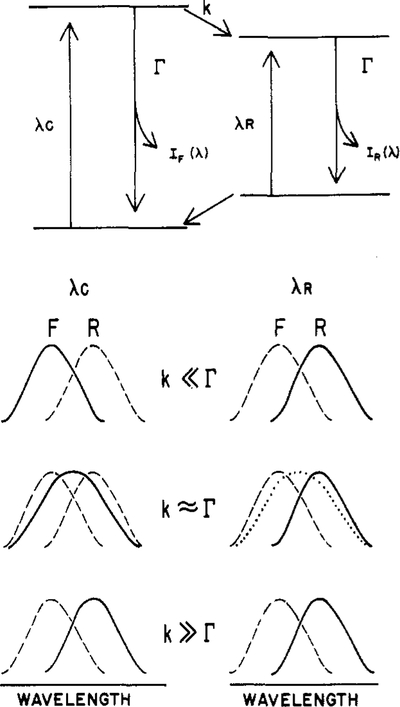
Figure 1:
Schematic description of the effects of red-edge excitation on emission spectra. The term λc indicates excitation which is central in the last absorption band of the fluorophore. The term λR indicates excitation on the red edge of the absorption band. The solid lines represent the observed spectra, and the dashed lines represent the emission spectra of either the F or the R state. The dotted line represents a possible consequence of reverse relaxation (see the text).

