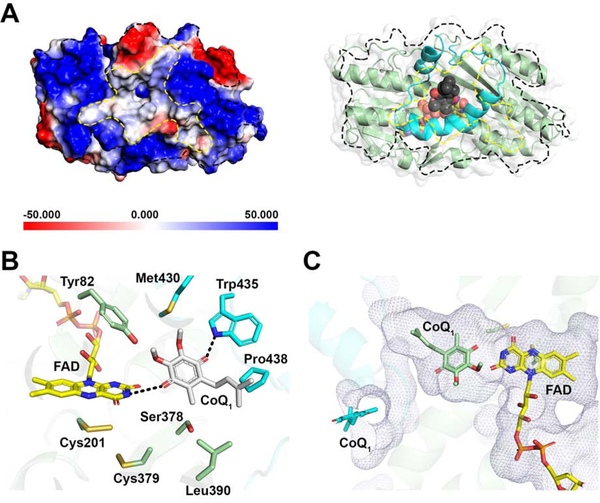
Figure 6. CoQ entry from the mitochondrial membrane side.
(A) Electrostatic potential energy surface map showing the CoQ entry/exit site denoted by the dashed line in the SQR-CoQ1 structure (left panel). In the right panel, the structure is shown in the same orientation as the left panel, with FAD and CoQ1 displayed as yellow and grey spheres, respectively. (B) A close-up showing the interactions between CoQ1 and active site residues. (C) Location of CoQ1 near FAD at the end of the hydrophobic tunnel (in mesh representation) as seen in the SQR-CoQ1 structure (green) versus at the entrance to the tunnel (cyan) in the SQR-CoQ1 + sulfide structure.

