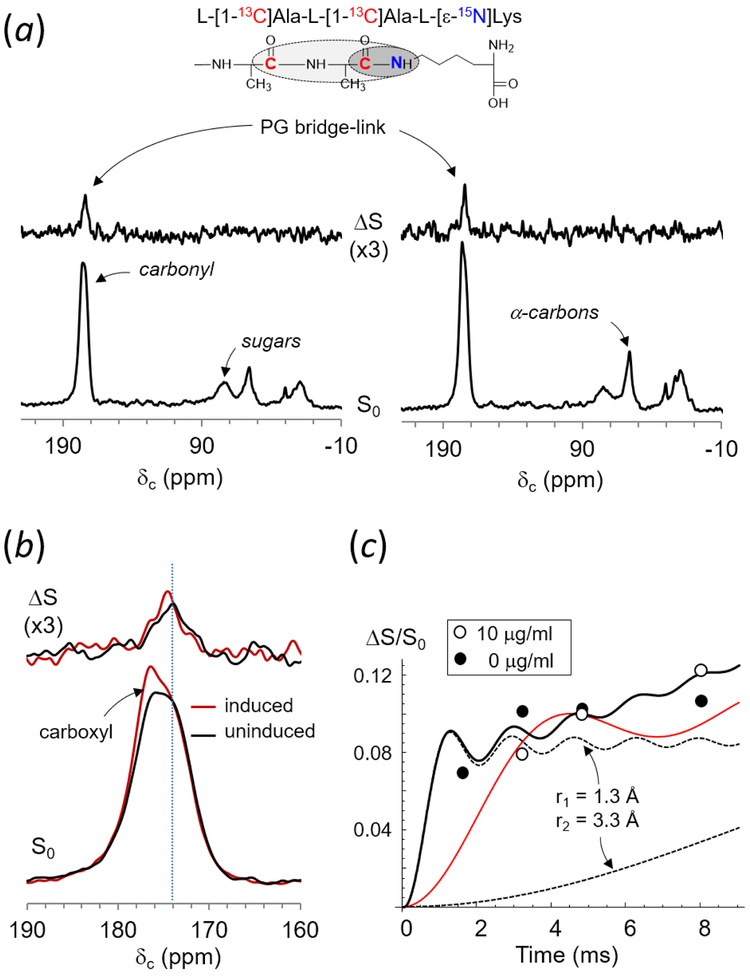
Figure 3.
(a) 13C{15N}REDOR of whole cells of E. faecalis labeled with l-[1-13C]Ala and l-[ε-15N]Lys at 4.8 ms dipolar evolution grown in absence (left) and presence of vancomycin at 10 μg/mL (right). 13C{15N}REDOR spectra of VRE grown in vancomycin concentrations of 0 and 20 μg/mL are results of 75248 and 320000 accumulated scans respectively. The magic angle spinning was at 5000 Hz. (b) Enlarged overlaid S0 and ΔS spectra centered at 174 ppm for VRE grown with vancomycin (red), and without (black). ΔS 174-ppm peak intensity, which was directly proportional to the bridge-link density, was independent of induction of vancomycin resistance in VRE. (c) 13C{15N}REDOR dephasings (ΔS/S0) of alanyl-carboxyl carbon at 174 ppm. Solid line is the calculated REDOR dephasing curve for two 13Cs in l-[1-13C]Ala-l-[1-13C]Ala bridge that are dephased by the 15N of l-[ε-15N]Lys with 13C-15N distances of 1.3 and 3.3 Å (dotted lines). 13C{15N}REDOR dephasing is highly selective for the PG-bridge structure, as demonstrated by the calculated dephasing curve for 13C-15N distances corresponding to 2.0 and 4.0 Å (red curve), which does not fit observed dephasings.

