
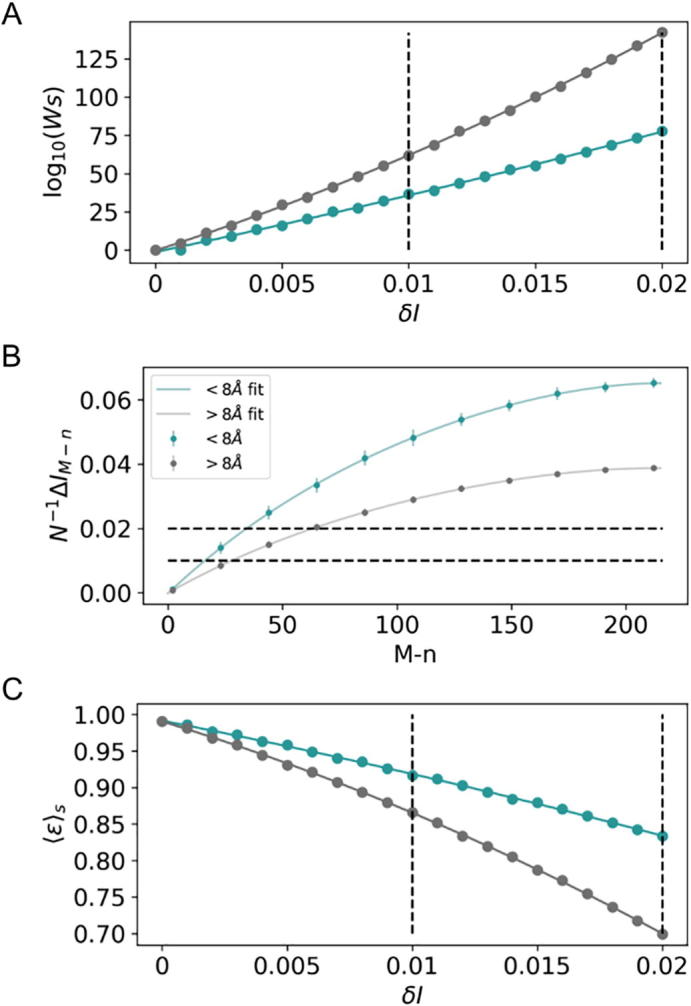
Fig. 2.
Degeneracy and error analysis for stochastic variables XN and YN involving interacting amino acids at short-range distances rc ≤ 8.0 Å (turquoise) and long-range distances rc > 8.0 Å (gray). (A) Total number ωS of native-like MSA models at various mutual-information resolutions δI. (B) Per-contact gaps of mutual information N−1ΔIM−n,rc as a function of the number M − n of “scrambled” sequence pairs in the reference native alignment. (C) Expectation values <ε>S (Eq. (15)) for the fraction of sequence matches across native-like MSA models at various mutual-information resolutions δI. Dashed lines highlight differences at δI values of 0.01 and 0.02.