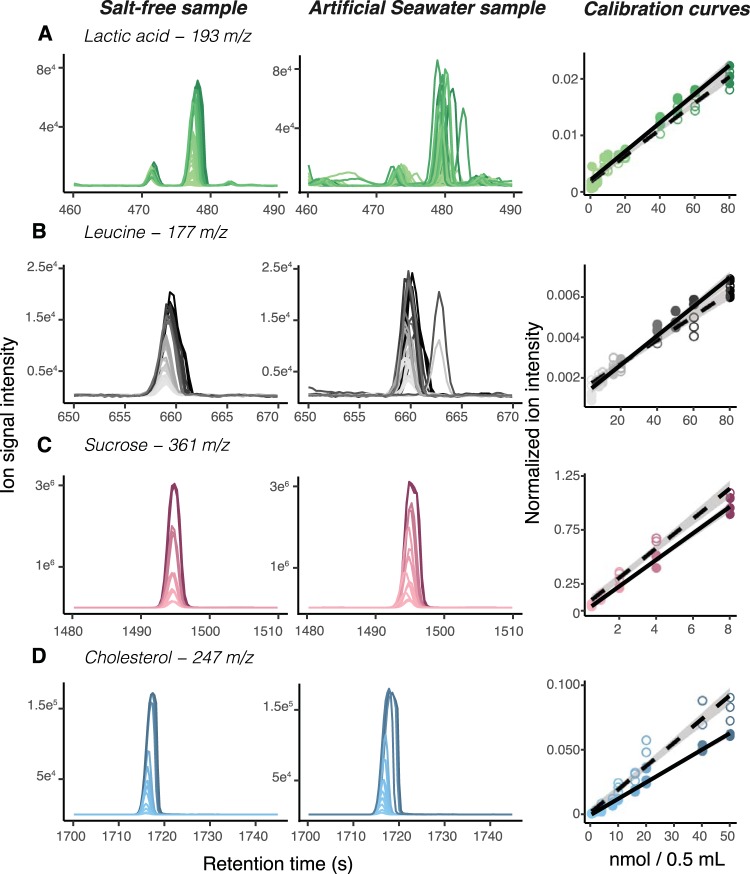
FIG 2.
Metabolite detection and quantification in artificial seawater using SeaMet in comparison to salt-free water. (A to D) Extracted ion chromatograms for select metabolites in salt-free and artificial seawater demonstrate reproducible metabolite detection across concentration gradients, as shown in associated calibration curves on the right. Spectra and points are shaded in scale with sample concentrations, where more-concentrated samples are represented by darker colors. Calibration curves were collected in a mixture of 45 metabolites (Table S1). Open circles, artificial seawater samples; filled circles, salt-free samples.

