FIG 3.
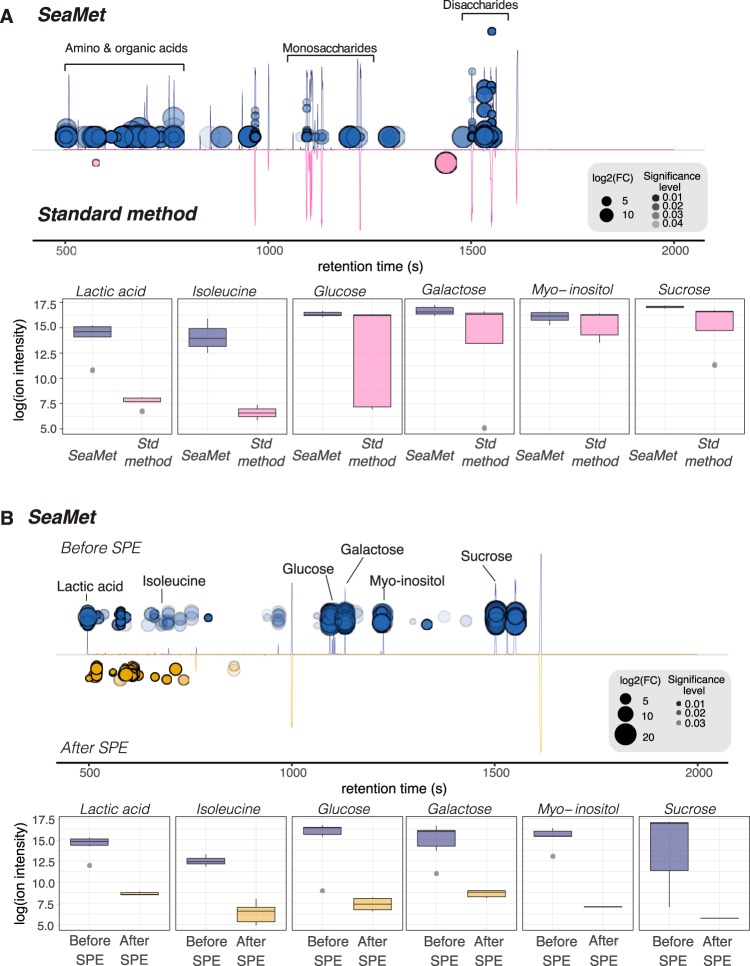
SeaMet enhances the detection of metabolites in marine samples. (A and B) Total ion chromatogram cloud plots from GC-MS profiles of metabolite mixtures indicate significant differences (Benjamini-Hochberg adjusted P < 0.05) between ion abundances when comparing SeaMet (blue, top) to the standard (Std) metabolite derivatization (pink, bottom) protocol for GC-MS samples (A) and chromatograms using SeaMet on marine samples before (blue, top) and after (yellow, bottom) solid-phase extraction (SPE) (B). Individual compound box plots are also shown to highlight improvements in metabolite detection using SeaMet. For the cloud plots, larger bubbles indicate higher log2(fold changes) between groups, and more intense colors represent lower t test P values in a comparison of individual feature (m/z ions) intensities. Samples prepared with SeaMet had high abundances of organic acids (lactic acid, succinic acid, and fumarate), amino acids (isoleucine, leucine, threonine, and valine), sugar alcohols (myo-inositol and mannitol), and sugars (fructose, glucose, cellobiose, maltose, ribose, galactose, and sucrose) in comparison to SPE-based sample preparation. Representatives of each class are indicated in panel B. To show signal improvement using SeaMet, samples for both comparisons included authentic metabolite standards representing multiple chemical classes.

