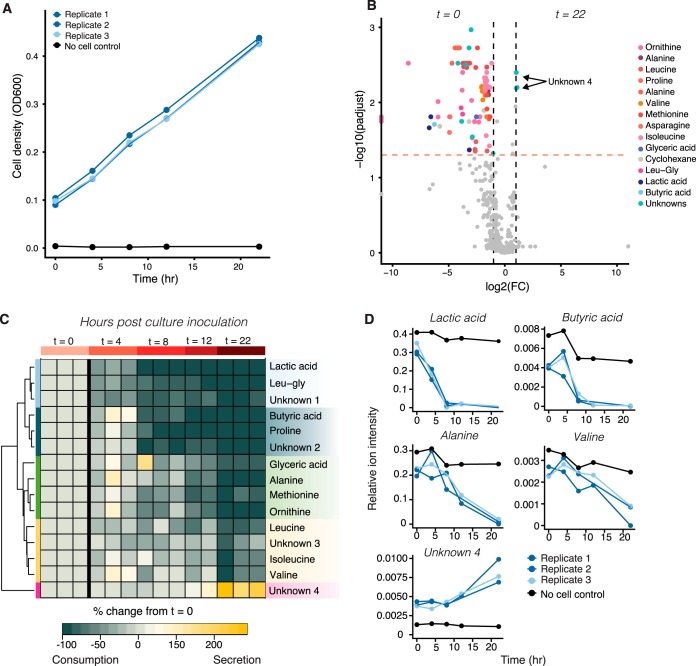
FIG 4.
Metabolite consumption and excretion during culture of the marine heterotroph Marinobacter adhaerens. (A) Cell densities increased during the first 22 h of culture growth in Marine broth. (B) Volcano plot showing differences in ion abundances in cell growth medium between the initial and final (22-h) sampling time points. Variables exhibiting high fold change values [log2(fold change), >2] and significant differences (adjusted P < 0.05) between the two sampling time points are colored according to their metabolite database (NIST) annotation. (C) A heatmap of metabolite abundances after 22 h relative to starting conditions indicates that some compounds, like the dipeptide leucine-glycine (Leu-gly), and lactic acid were taken up before others, such as branched-chain amino acids. After 12 to 22 h of growth, the bacteria excreted an unknown compound predicted to contain an amine group (unknown 4). Hierarchical clustering shows groups of metabolites that changed significantly during growth (colored bars on left; B.H. adjusted P < 0.05; fold change, >2). These metabolite groups represent successive stages in M. adhaerens consumption and production of marine broth components. (D) Relative ion abundances over time for select metabolites from each cluster group shown in panel C. The blue lines represent biological replicate cultures, while the black lines show results from a control sample with no cell addition. Low variation among biological replicates highlights the reproducibility of SeaMet.

