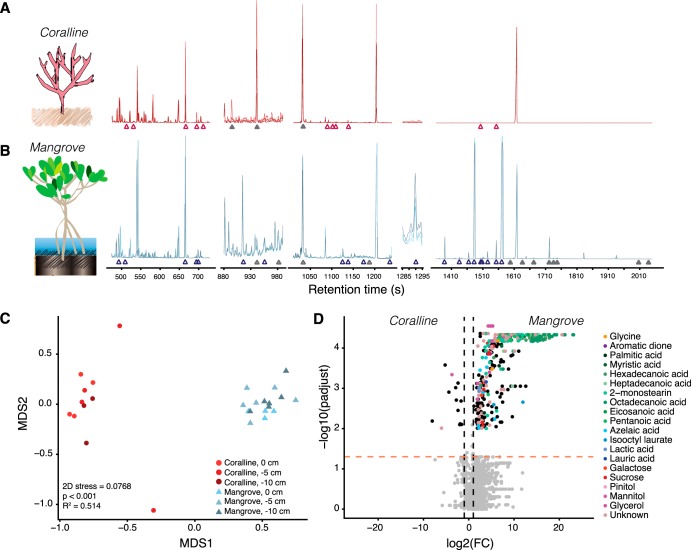
FIG 5.
Metabolite profiles from marine habitats acquired with SeaMet. (A and B) GC-MS metabolomic profiles from coralline (A) and mangrove (B) sediment porewaters showed high concentrations of identified metabolites (open triangles), e.g., fatty acids and sugars that explain multivariate differences in compositions shown in panel C. Profiles also revealed unknown peaks (filled triangles) for which no matches were found in public databases (Table S4). (C) Bray-Curtis-informed nonmetric multidimensional scaling analysis of sediment porewater metabolomic profiles from coralline (red) and mangrove (blue) habitats across sediment depths. ADONIS P and R2 values showed a significant correlation between sampling location and metabolite composition. (D) Volcano plot showing differences in detected ion abundances between habitats. Significant ions (adjusted P < 0.05) with a log2(fold change) of >2 are shaded according to their metabolite database (NIST) annotation based on the combined mass spectra of the deconvolved peak. All ions detected for each peak are represented in the volcano plot.

