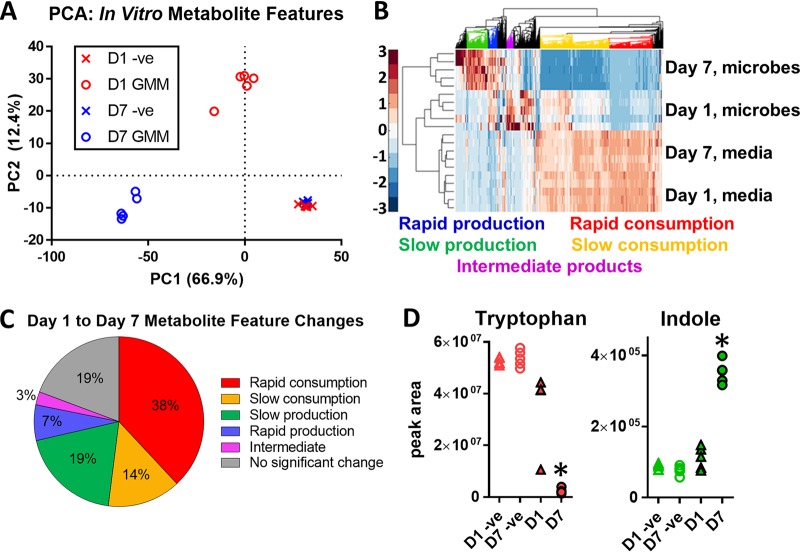
FIG 4.
Metabolite profiles from in vitro cultured cecal luminal contents. (A) Scatter plot of the first two scores from PCA representing microbial metabolites produced on day 1 and day 7. (B) Heat map of detected ion peaks with different patterns of substrate utilization and product formation. (C) Percentage distribution of detected features classified as products, substrates, or intermediates based on their time profiles. (D) Profiles of tryptophan and indole in the cecal luminal content cultures. Filled and open markers represent inoculated cultures and tubes incubated without luminal contents, respectively. Triangles and circles represent day-1 and -7 time points, respectively. The colors correspond to the classifications in the heat map and pie chart. *, P < 0.05 compared to inoculated culture at day 1 (two-tailed t test).

