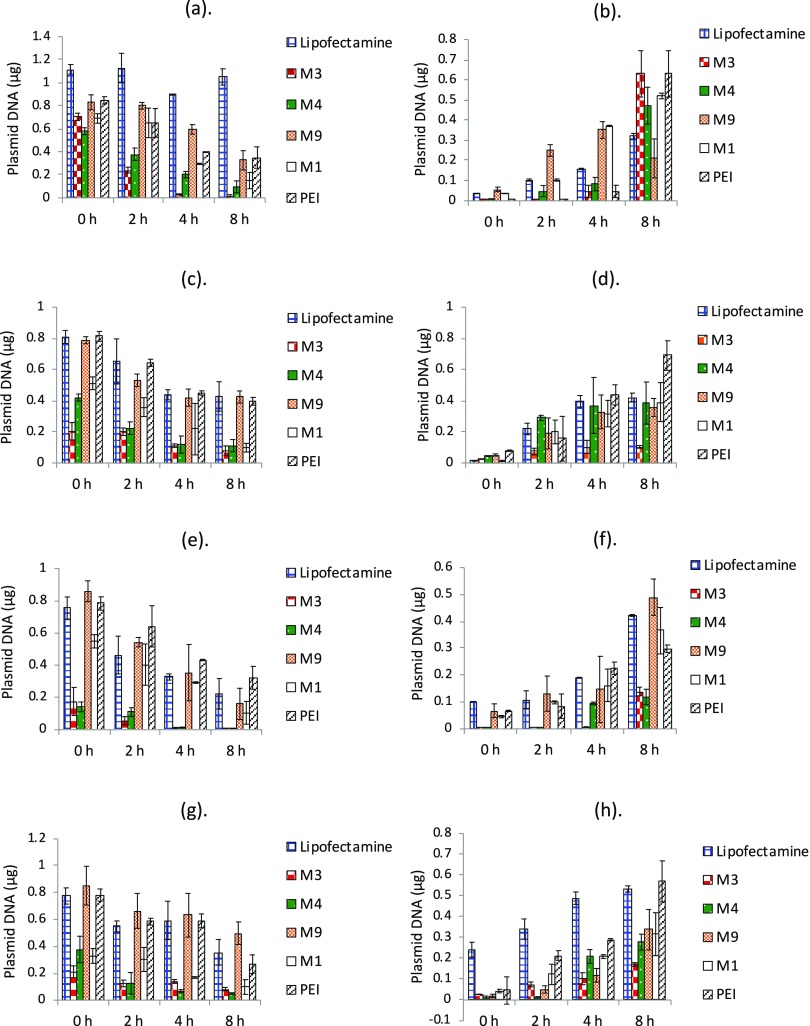
Figure 2.
Amounts of plasmid DNA quantified in cellular fraction and media fraction in different cell lines. (a) B16-F10 cellular fraction, (b) B16-F10 media fraction, (c) CHOK-1 cellular fraction, (d) CHOK-1 media fraction, (e) HaCaT cellular fraction, (f) HaCaT media fraction, (g) HEK-293 cellular fraction, and (h) HEK-293 media fraction. Cells were incubated with different nanocomplexes for 4 h, followed by q-PCR-based estimation of pMIR plasmid at 0, 2, 4, and 8 h in both media and cellular fractions. Data are presented as mean ± standard deviation of at least three independent experiments.

