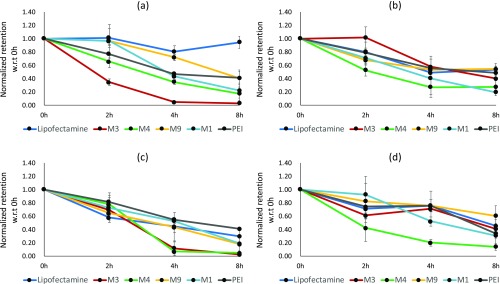
Figure 3.
Normalized cellular fraction retention trends in different cell lines. (a) B16-F10, (b) CHOK-1, (c) HaCaT, and (d) HEK-293 cells were incubated with different nanocomplexes for 4 h, followed by q-PCR-based estimation of pMIR plasmid at 0, 2, 4, and 8 h. Normalization was performed by dividing the estimated cellular fraction amount at any time points with estimated amounts of that nanocomplex at 0 h after media change. Data are presented as mean ± standard deviation of at least three independent experiments.

