Figure 5.
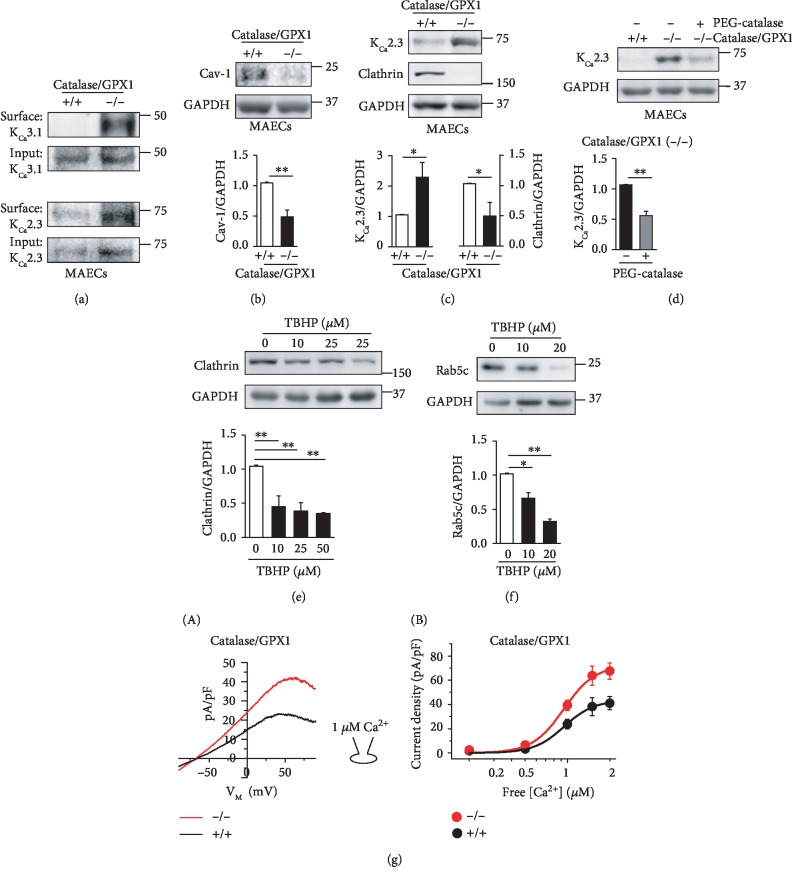
Catalase and GPX1 knockdown slows down KCa2.3 or KCa3.1 endocytosis. (a) PM levels of KCa2.3 or KCa3.1 in MAECs from wild-type and catalase−/−/GPX1−/− mice. (b) Cav-1 levels in MAECs from wild-type and catalase−/−/GPX1−/− mice. (c) KCa2.3 and clathrin levels in MAECs from wild-type and catalase−/−/GPX1−/− mice. (d) Elevated KCa2.3 levels by catalase/GPX1 knockdown were reversed by a membrane permeable catalase, PEG-catalase. (e, f) A H2O2 donor TBHP reduced clathrin (e) or Rab5c (f) levels in a concentration-dependent manner. (g) KCa3.1 currents activated by loading cells with 1 μM Ca2+ (A) and the current-[Ca2+]i relationship at +50 mV (B). The current densities at +50 mV are plotted against [Ca2+]i. Blots shown are representative of three to four experiments performed with three to four different cultures. Bar graphs represent the mean ± SEM. ∗P < 0.05, ∗∗P < 0.01.

