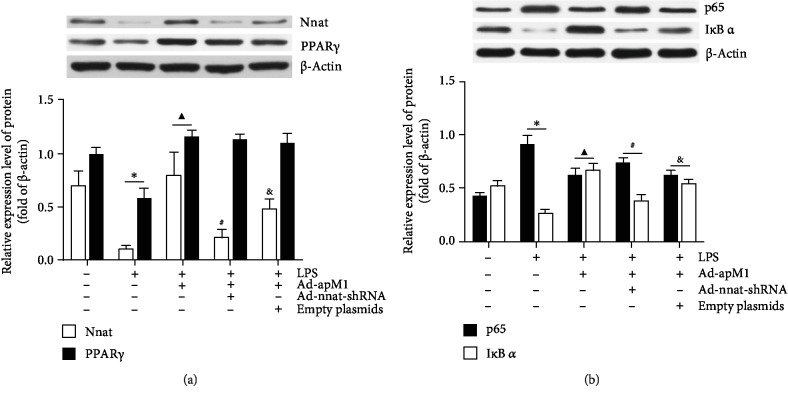
Figure 5.
The protein expression levels of Nnat, PPAR γ, p65, and IκB α in each experimental group. Cell lysates were collected and subjected to western blotting to examine the protein expression levels of Nnat, PPAR γ, p65, and IκB α. (a) The protein expression levels of Nnat and PPAR γ in each experimental group. (b) The protein expression levels of p65 and IκB α in each experimental group. Values were means ± S.E.M. for six individual experiments. ∗p < 0.05 vs. the control group; ▲p < 0.05 vs. the LPS group; #p < 0.05 vs. the LPS+Ad-apM1 group; &p < 0.05 vs. the LPS+Ad-apM1+Ad-nnat-shRNA group.

