
Figure 3.
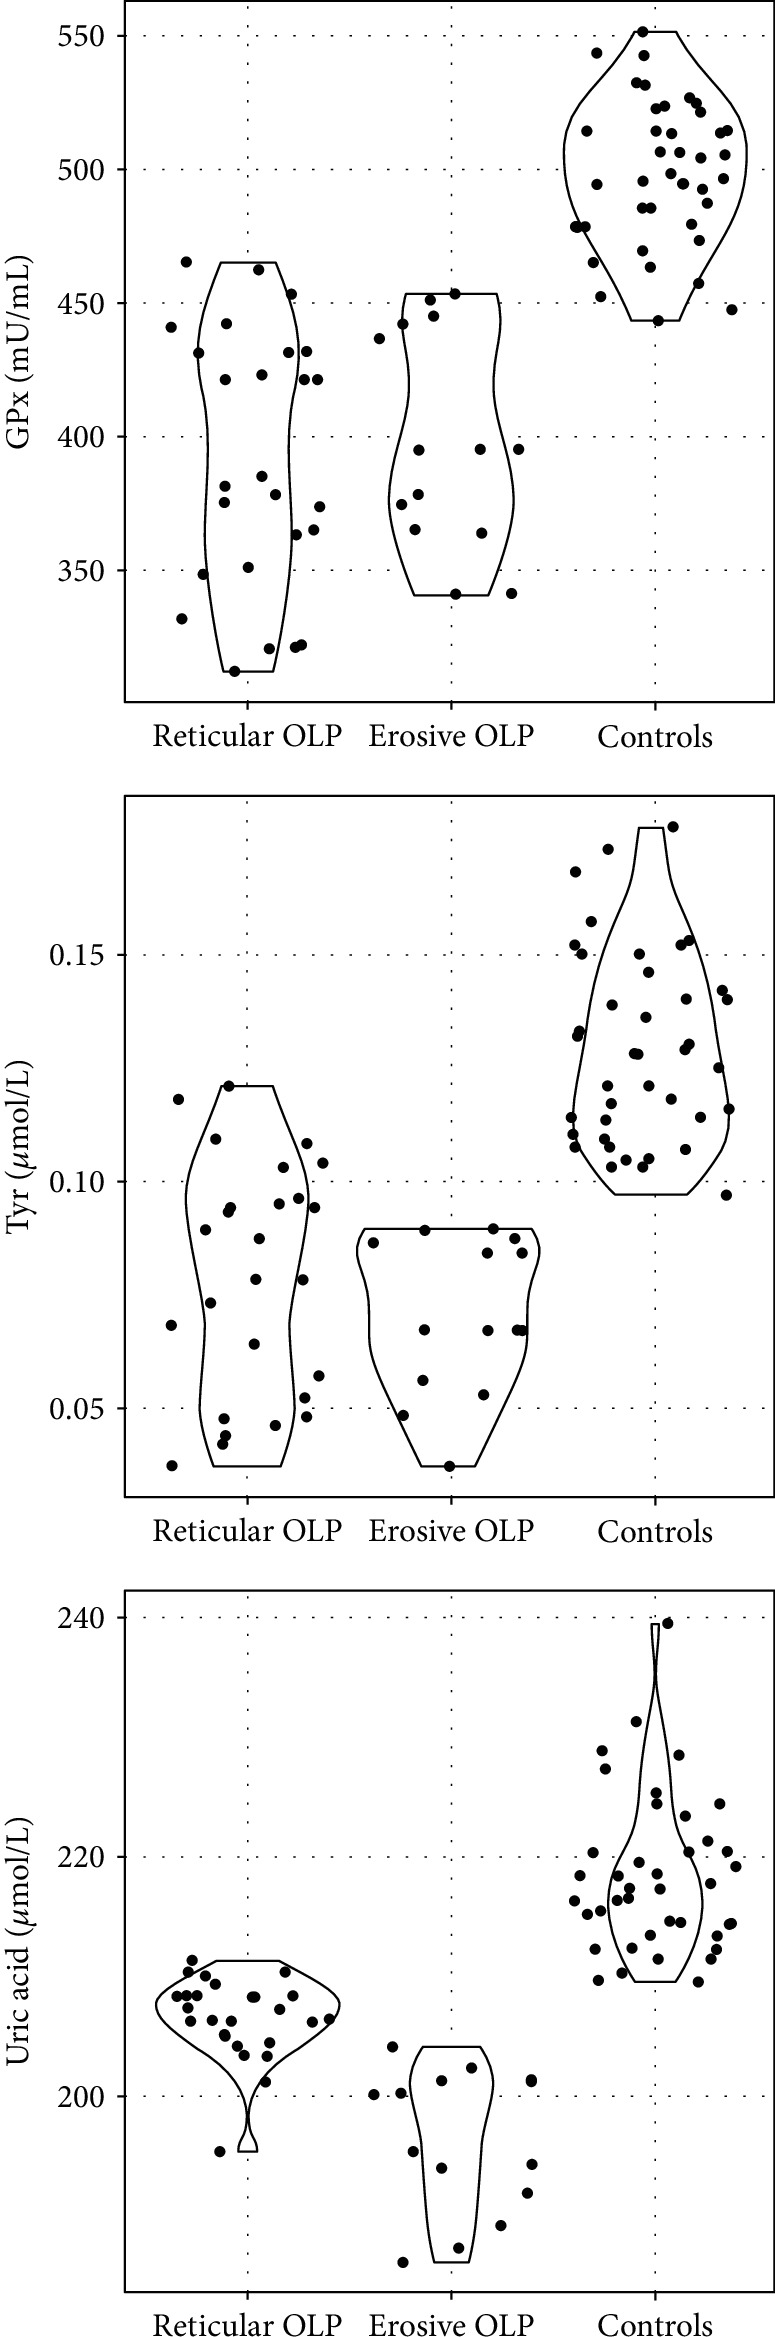
Violin plot representing tyrosine (Tyr), uric acid (UA), and glutathione peroxidase (GPx) activity in the subgroups of patients (erosive and reticular OLP) and controls. The dots on the graph represent individual results in each group.
Official websites use .gov
A
.gov website belongs to an official
government organization in the United States.
Secure .gov websites use HTTPS
A lock (
) or https:// means you've safely
connected to the .gov website. Share sensitive
information only on official, secure websites.
Violin plot representing tyrosine (Tyr), uric acid (UA), and glutathione peroxidase (GPx) activity in the subgroups of patients (erosive and reticular OLP) and controls. The dots on the graph represent individual results in each group.