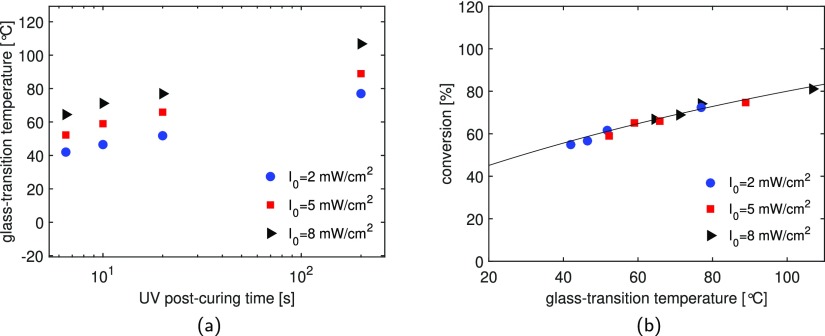
Figure 6.
Effect of UV light intensity: glass-transition temperature as a function of irradiation time for samples cured under different light intensities (a) and monomer conversion as a function of glass-transition temperature for samples UV postcured for 6.5, 10, 20, and 200 s. The markers are the experimental results and the line is the prediction based on the Hale model (b).

