
Figure 1.
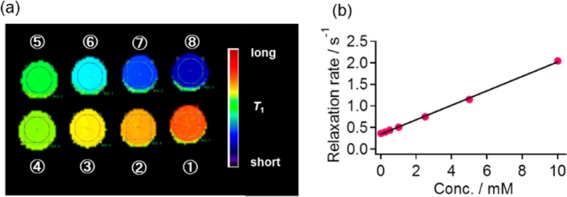
(a) T1-weighted images obtained for various concentrations of 4(cP) and (b) a plot of relaxation rate vs 4(cP) concentration. The numerical numbers in (a) refer to concentrations of (1) 0, (2) 0.156, (3) 0.313, (4) 0.625, (5) 1.25, (6) 2.50, (7) 5.00, and (8) 10.0 mM. The colored bar in (a) represents T1.