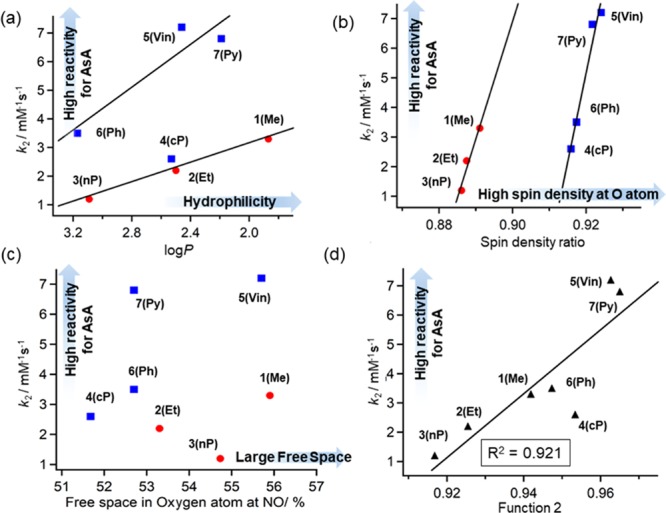
Figure 4.

Plots of (a) k2 vs log P, (b) k2 vs SDR, (c) k2 vs FrS, (d) k2 vs function 2. Solid lines indicate least-squares fits obtained for data including and excluding species with π-orbitals [(a) and (b) respectively] and for all data (d). In (d), function 2 is defined as SDR + 0.095(1/log P) (see the text). The numerical number “0.095” in function 2 was determined by the smallest R2 value according to the least-squares fitting.
