
Figure 2.
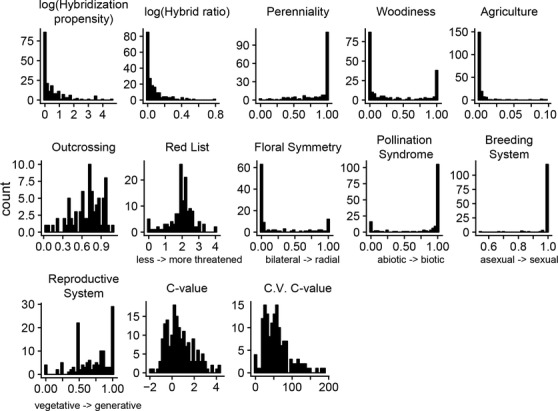
Distributions of family‐level hybridization metrics and family‐average traits. See Table 1 for trait descriptions and units. Nonintuitive trait values have brief descriptions on the x‐axes.
Official websites use .gov
A
.gov website belongs to an official
government organization in the United States.
Secure .gov websites use HTTPS
A lock (
) or https:// means you've safely
connected to the .gov website. Share sensitive
information only on official, secure websites.
Distributions of family‐level hybridization metrics and family‐average traits. See Table 1 for trait descriptions and units. Nonintuitive trait values have brief descriptions on the x‐axes.