
Figure 3.
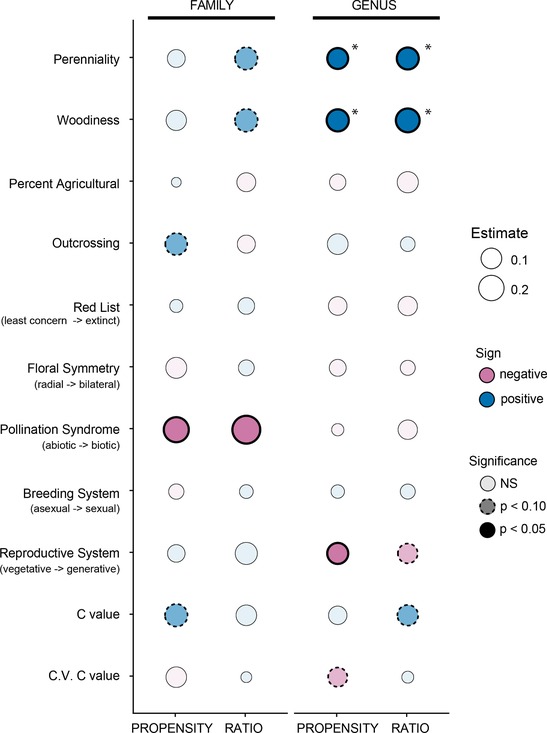
Predictors of hybridization propensity and hybrid ratio at the family (left) and genus (right) levels from PGLS univariate regressions. Sizes of the circles indicate the absolute value of the strength of the estimate. Color indicates the sign (positive = blue, negative = pink) of the estimate. The transparency and border indicate the significance of the estimate: lightest shaded circles were not significant (P > 0.10), medium shading with dashed borders indicates a trend (P < 0.10), and darkest shading with solid bold borders indicates statistical significance (P < 0.05). Asterisks indicate that the relationship is significant after a Benjamini–Hochberg procedure.