
Fig. 2.
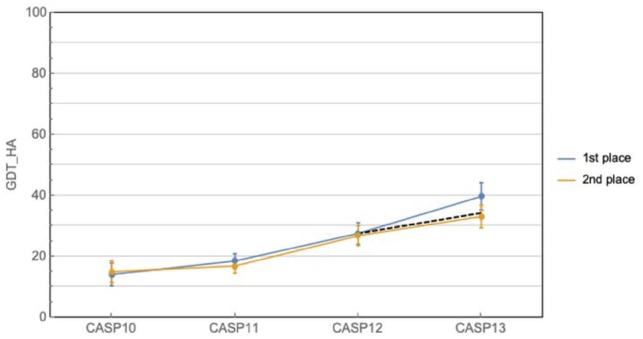
Historical CASP performance in prediction of fine-grained protein topology. Curves show the best and second best predictors at each CASP, while the dashed line shows the expected improvement at CASP13 given the average rate of improvement from CASP10 to 12. Ranking is based on CASP assessor’s formula, and does not always coincide with highest mean GDT_HA (e.g. CASP10). Error bars correspond to 95% confidence intervals