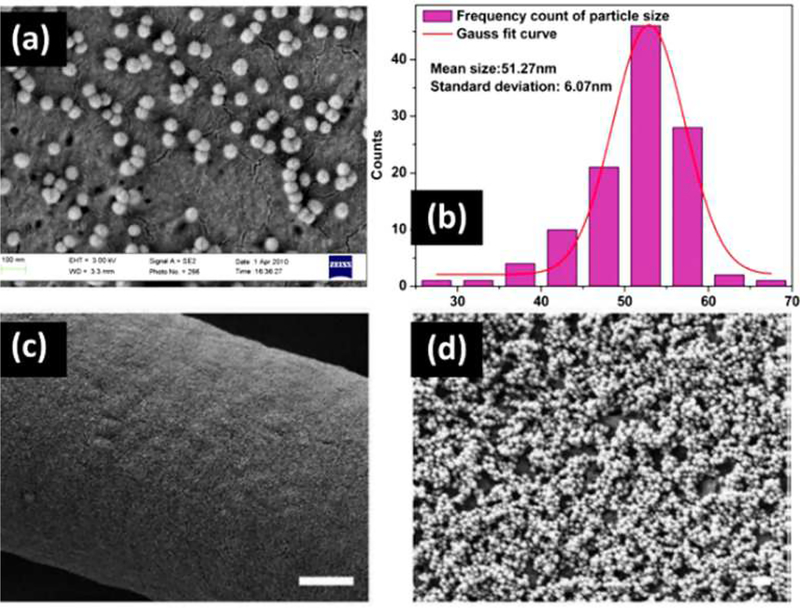
Figure 6. SEM images of synthesized SNPs.
(a) histogram of particle size distribution measured from SEM images, (c,d) SEM images of coated fiber surface with 5 layers of SNPs, (e) atomic force microscopic (AFM) image of coated fiber surface with 5 layers of SNPs, (f) evolution of water contact angle with contact time for three-dimensional fibrous matrix as control, and coated fiber surface with 1 layer, 3 layers and 5 layers of SNPs. The scale bar for SEM image c is 200 nm. Figure reproduced with permission from ref [107]. Copyright 2014 Wiley.

