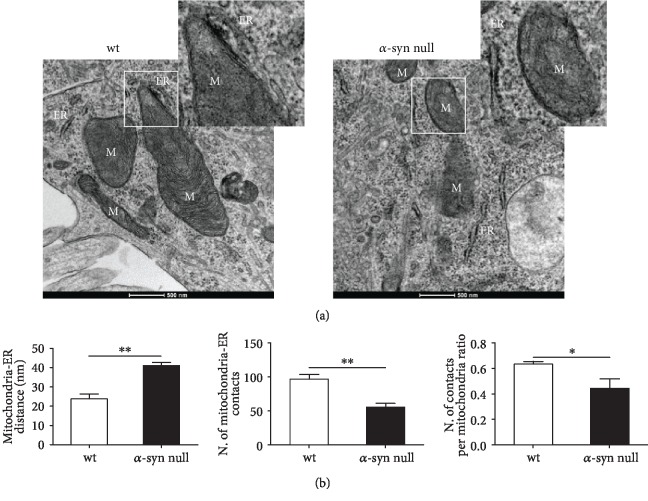
Figure 4.
TEM-based morphological analysis of mitochondria-ER interaction of primary cortical neurons of wt and α-syn null mice. (a) Representative images of TEM showing the mitochondria-ER interactions in primary cortical neurons of wt and α-syn null mice. ER = endoplasmic reticulum; M = mitochondria. Scale bar: 500 nm. (b) The image analysis showed an increased distance between mitochondria and ER, a decreased number of MERCs, and a decreased ratio in the number of contacts per mitochondria in α-syn null neurons when compared to wt neurons. ∗P < 0.05 and ∗∗P < 0.01, unpaired two-tailed t-test. Data are presented as mean ± SEM (n = 5).

