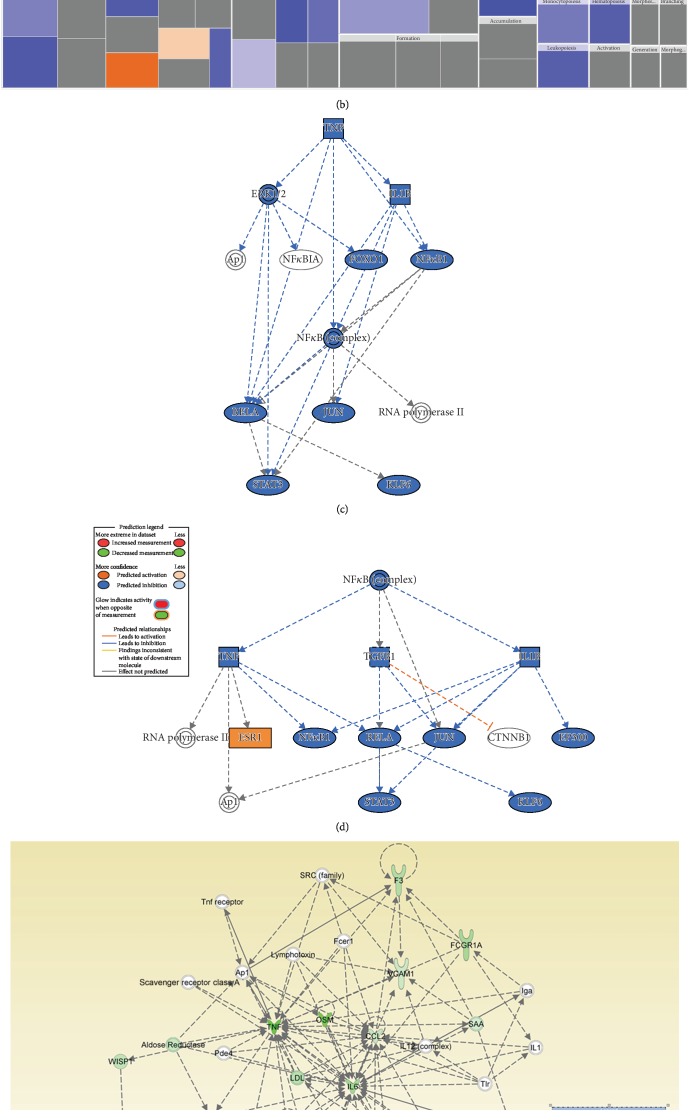
Figure 4.
Bioinformatic analysis of signaling networks regulated in BMS-833923-treated human bone marrow skeletal (mesenchymal) stem cells (hMSCs). (a) Disease and function heat map depicting activation (red) or inhibition (blue) of the indicated functional and disease categories identified in the downregulated transcripts in BMS-833923-treated hMSCs. (b) Heat map illustrating the tissue development functional category. (c) Illustration of the TNF and (d) NFκB networks with predicted activated state based on transcriptome data. Figure legend illustrates the interaction between molecules within the network. (e) Illustration of the connective tissue disorders, organismal injury and abnormalities, and skeletal and muscular disorder network.

