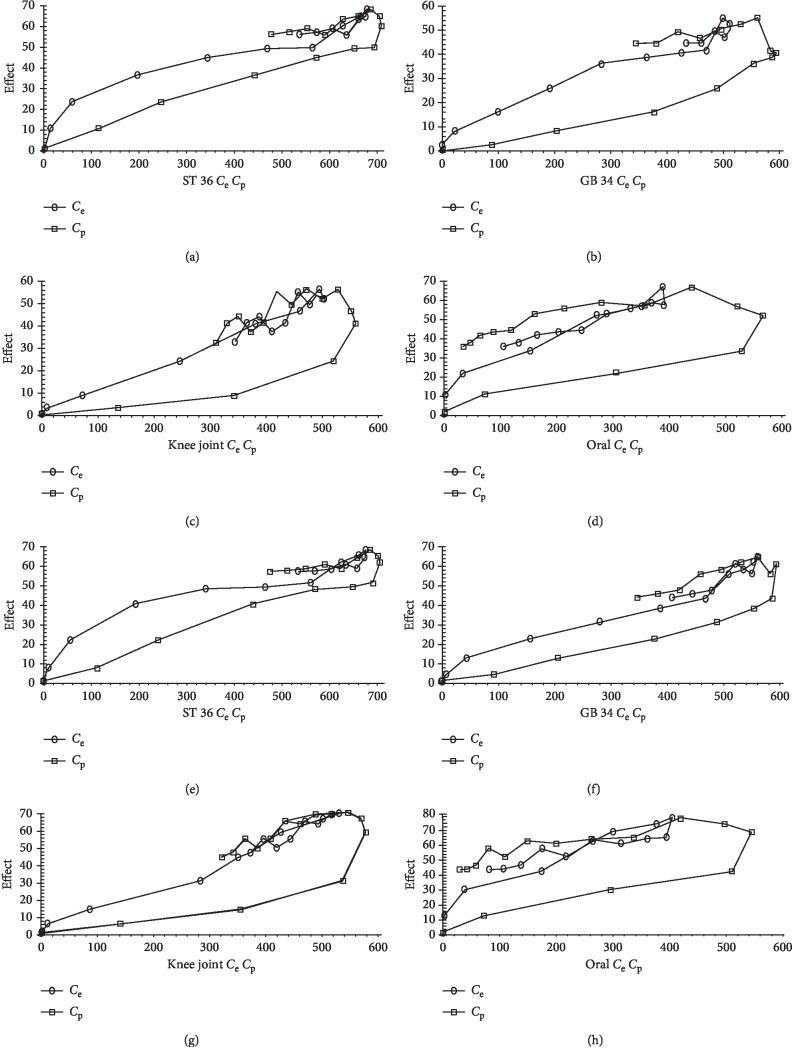
Figure 4.
The Ce-effect curves and Cp-effect curves of arginine and citrulline in the different groups. (a)–(d): The curves of arginine for the ST 36, GB 34, knee-joint, and oral administration groups. (e)–(h) The curves of citrulline for the ST 36, GB 34, knee-joint, and oral administration groups.

