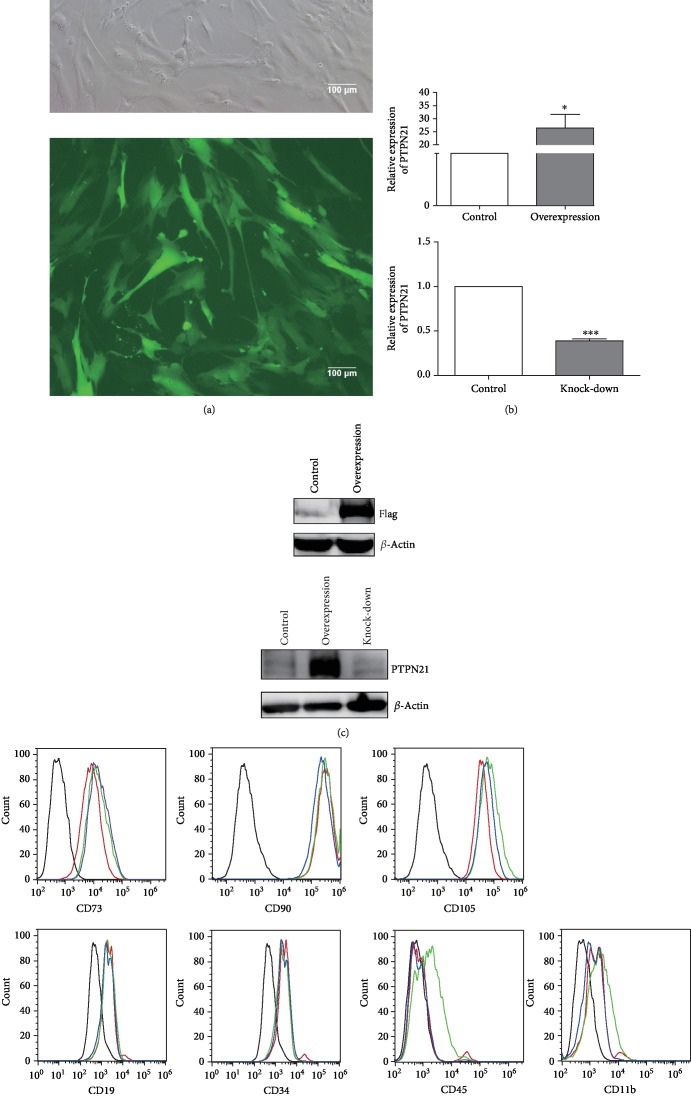
Figure 2.
Phenotypes of different groups of transfected BM-MSCs. (a) The transfection efficiency of the control group is shown. No less than 90% of BM-MSCs expressed green fluorescent protein. Scale bar = 100 μm. The efficiency of overexpression or knock-down of PTPN21 was confirmed by RT-qPCR (b) and western blot analysis (c). A flag tag was attached to the C terminus of PTPN21 coding sequences in the overexpression plasmid, which acted as a reporter gene for transfection efficiency identification. (d) Flow cytometry analysis of cell surface marker expression by transfected BM-MSCs. The black-lined histograms indicate isotypic controls, while the red-lined, blue-lined, and green-lined histograms represent the control, overexpression, and knock-down groups, respectively. All experiments were repeated at least three times. Data are presented as mean ± SD. ∗p < 0.05.

