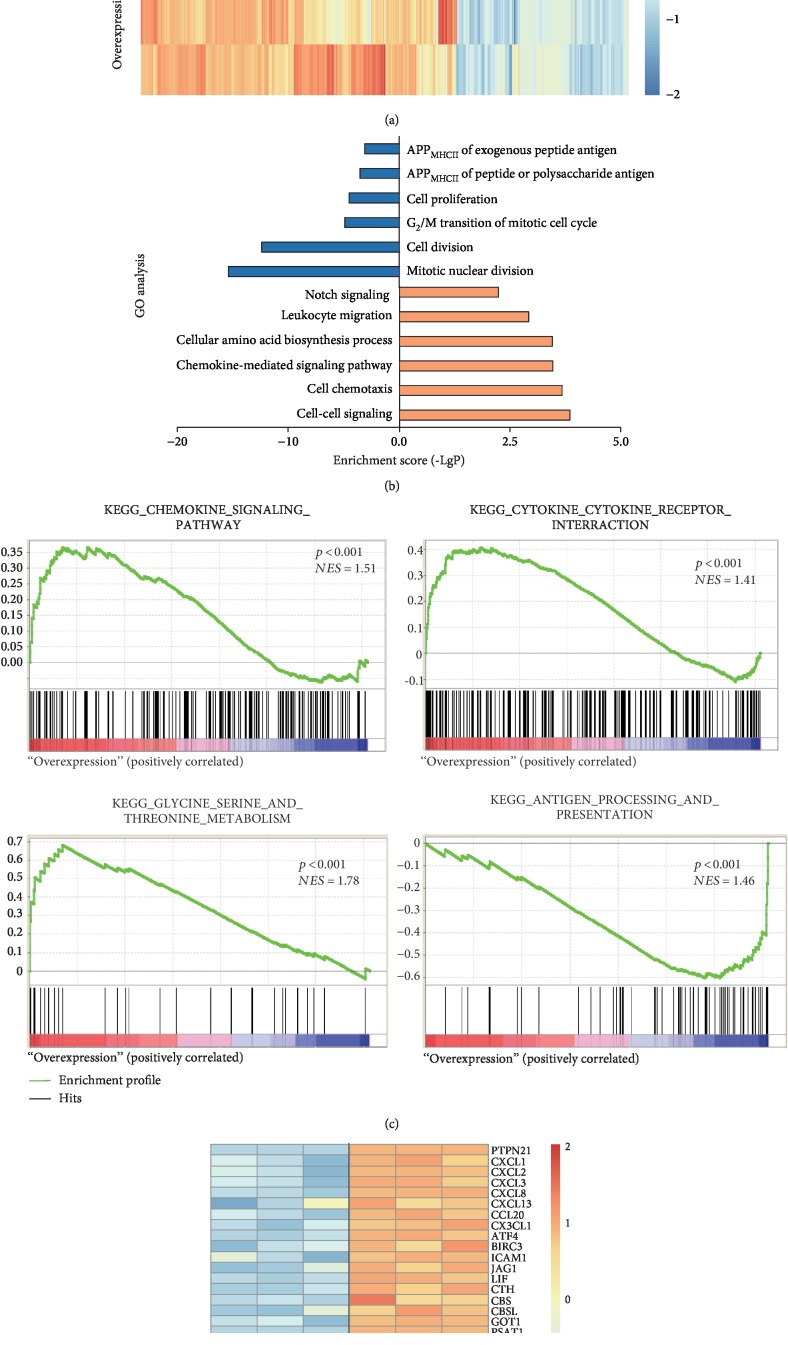
Figure 8.
Analysis of transcriptome data in the control and overexpression BM-MSCs. (a) Heat map of DEG cluster. The expression levels of 435 genes change significantly in the overexpression group compared to the control group (p ≤ 0.001, (∣log2 FC∣) ≥ 1). Of these, 282 are commonly upregulated and 153 are commonly downregulated. (b) GO analysis of DEGs. Selected significant ontology terms are shown. The blue-colored columns indicate downregulation genes, while the orange-colored columns indicate upregulation genes. (c) GSEA analyses of gene expression profile in overexpression versus control cells. The normalized enrichment score (NES) and p values are shown. (d) Heat map of enriched DEGs between two groups is shown. APPMHCII: antigen processing and presentation via MHC class II.

