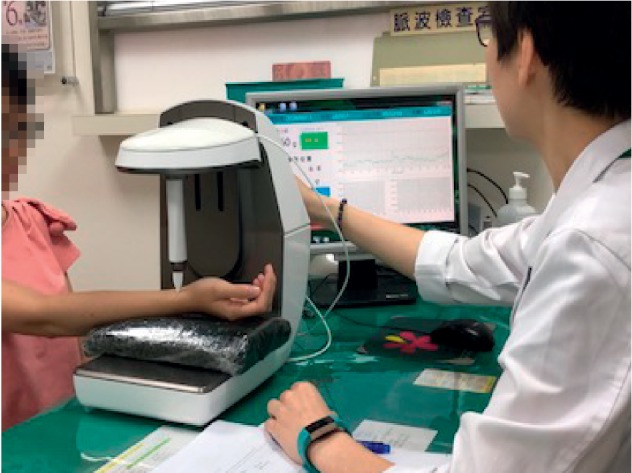
Figure 2.

Pulse assessment of a study participant. The high-precision pressure sensor was positioned on each marked position of the Cun, Guan, and Chi pulses of the wrist. The biological signal of the radial pulse was then digitised to provide graphical analysis. The best spectrogram, which displayed the greatest amplitude, was then recorded.
