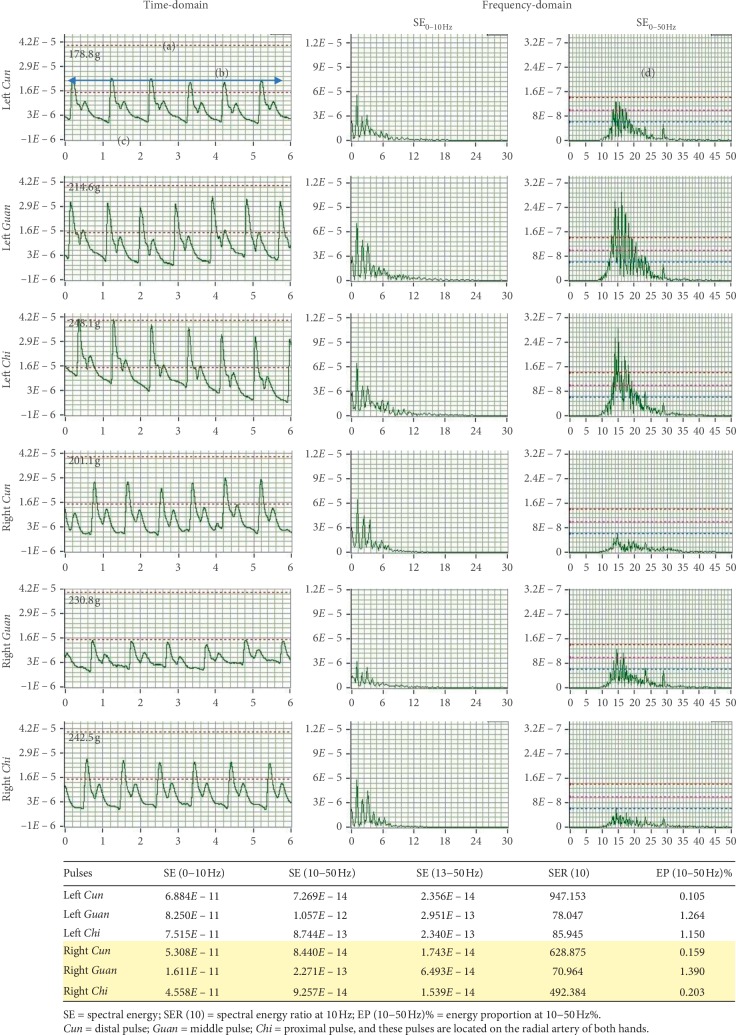
Figure 4.
A typical report of a study participant generated from the pulse sphygmograph providing the time- and frequency-domain analyses of the six pulse positions. Each pulse profile is characterised by the following: (a) depth indicates light (0−60 g), moderate (60−120 g), and heavy (>120 g) pressure on the radial artery; (b) rate indicates the pulse rate, calculated by multiplying the number of waves by 10; (c) waveform provides information on the status of Qi and blood. Twenty-eight common pulse waveforms exist, as described in Introduction; and (d) density provides information on the status of heat, cold, dampness, and Qi stagnation in the body, while intensity indicates the amplitude of these causative factors.

