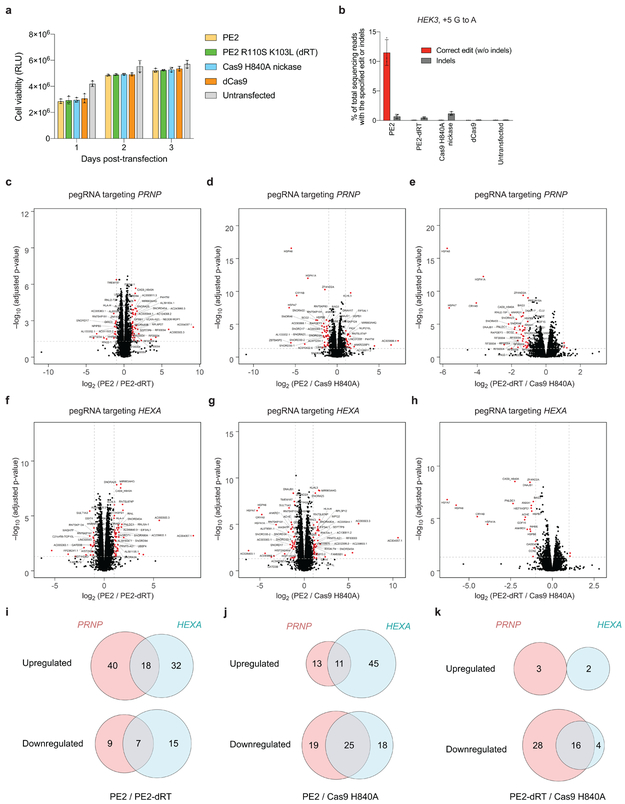
Extended Data Figure 8. Effects of PE2, PE2-dRT, Cas9 H840A nickase, and dCas9 on cell viability and on transcriptome-wide RNA abundance.
HEK293T cells were transiently transfected with plasmids encoding PE2, PE2 R110S K103L, Cas9 H840A nickase, or dCas9, together with a HEK3-targeting pegRNA plasmid. Cell viability was measured for the bulk cellular population every 24 hours post-transfection for 3 days using the CellTiter-Glo 2.0 assay (Promega). (a) Viability, as measured by luminescence, at 1, 2, or 3 days post-transfection. Values and error bars reflect mean±s.e.m. of n=3 independent biological replicates, each performed in technical triplicate. (b) Percent editing and indels for PE2, PE2 R110S K103L, Cas9 H840A nickase, or dCas9, together with a HEK3-targeting pegRNA plasmid that encodes a +5 G to A edit. Editing efficiencies were measured on day 3 post-transfection from cells treated alongside of those used for assaying viability in (a). Values and error bars reflect mean±s.d. of n=3 independent biological replicates. (c-k) Analysis of cellular RNA, depleted for ribosomal RNA, isolated from HEK293T cells expressing PE2, PE2-dRT, or Cas9 H840A nickase and a PRNP-targeting or HEXA-targeting pegRNA. RNAs corresponding to 14,410 genes and 14,368 genes were detected in PRNP and HEXA samples, respectively. (c-h) Volcano plot displaying the −log10 FDR-adjusted p-value vs. log2-fold change in transcript abundance for each RNA, comparing (c) PE2 vs. pE2-dRT with PRNP-targeting pegRNA, (d) PE2 vs. Cas9 H840A with PRNP-targeting pegRNA, (e) PE2-dRT vs. Cas9 H840A with PRNP-targeting pegRNA, (f) PE2 vs. PE2-dRT with HeXa-targeting pegRNA, (g) PE2 vs. Cas9 H840A with HEXA-targeting pegRNA, (h) PE2-dRT vs. Cas9 H840A with HEXA-targeting pegRNA. Red dots indicate genes that show ≥2-fold change in relative abundance that are statistically significant (FDR-adjusted p < 0.05). (i-k) Venn diagrams of upregulated and downregulated transcripts (≥2-fold change) comparing PRNP and HEXA samples for (i) PE2 vs PE2-dRT, (j) PE2 vs. Cas9 H840A, and (k) PE2-dRT vs. Cas9 H840A. Values for each RNA-seq condition reflect the mean n=5 biological replicates. Differential expression was assessed using a two-sided t-test with empirical Bayesian variance estimation.

