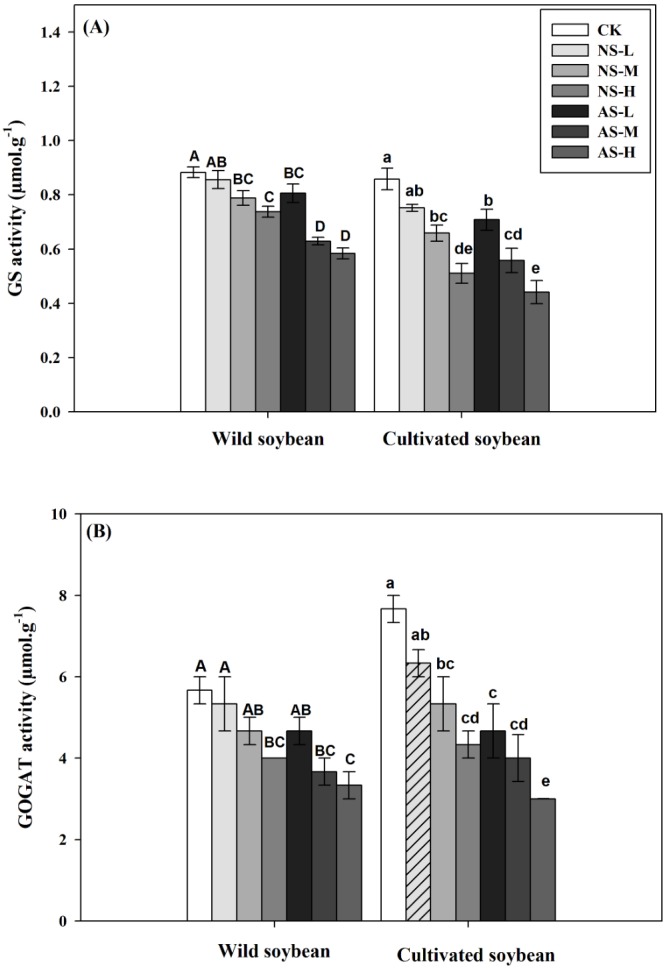
Figure 2. Changes in GS (A) and GOGAT (B) activities of wild and cultivated soybean leaves under control and salt stress treatments.

Bars indicate SE of mean, n = 3 and different letters (A–G and a–g) above the columns indicate significant differences at P < 0.05 according to Duncan’s method. W, wild soybean; C, cultivated soybean; CK, Control; L-NS, M-NS and H-NS represent low (10 mmol L−1), medium (20 mmol L−1) and high (30 mmol L−1) concentrations of saline salt stress, respectively; while L-AS, M-AS and H-AS represent low (10 mmol L −1), medium (20 mmol L−1) and high (30 mmol L−1) concentrations of alkaline salt stress, respectively.
