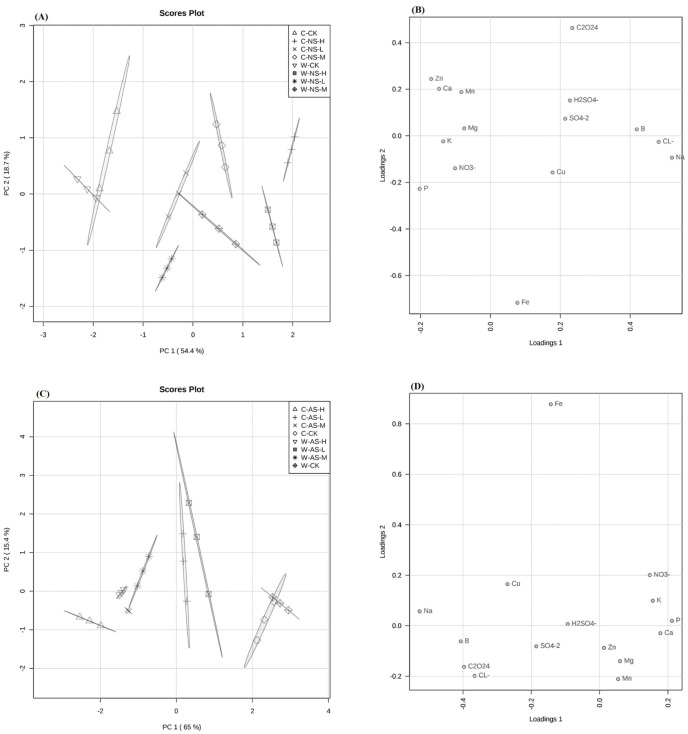
Figure 5. Principal component analysis (PCA) of wild and cultivated soybean seedlings ionome variation.
(A) Root ionome variation among neutral salt stress samples. (B) Loadings of ions to PC1 and PC2 in roots among neutral salt stress samples (C) Root ionome variation among alkaline salt stress samples. (D) loadings of ions to PC1 and PC2 in roots among alkaline salt stress samples.

