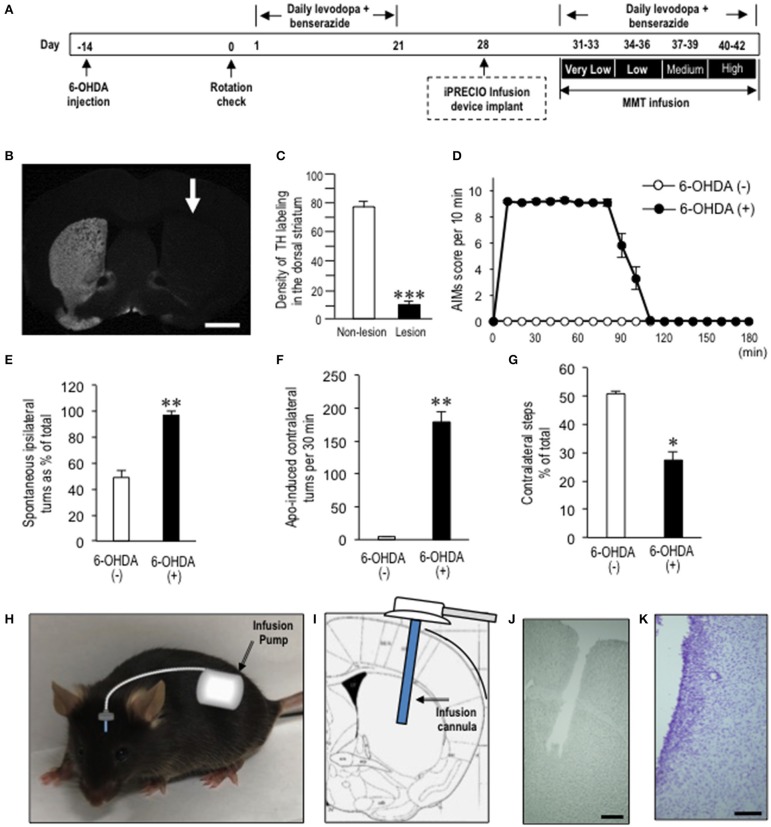
Figure 1.
Generation of dyskinetic mice for the intracerebral brain infusion (iCBI) experiments. (A) Timeline of experimentations (see “Materials and Methods” section). Dyskinetic mice were implanted with programmable intracerebral brain infusion (iCBI) systems equipped with iPRECIOTM micro infusion pumps at day 28. After a recovery of 3 days, they restarted receiving daily levodopa/benserazide treatments for the next 12 days. Simultaneously, MMT-treated dyskinetic mice received continuous intrastriatal infusion of MMT 0.28 ng/μl at a flow rate of 1.0 μl/h for the first 3 days (days 31–33), MMT 1.12 ng/μl at a flow rate of 1.0 μl/h for the next 3 days (days 34–36), MMT 4.48 ng/μl at a flow rate of 1.0 μl/h for the next 3 days (days 37–39), and MMT 17.93 ng/μl a flow rate of 1.0 μl/h for the last 3 days (days 40–42). In parallel, PBS-treated dyskinetic mice received PBS under the same protocol. AIM scoring tests for MMT- or PBS-treated mice were done at days 33, 36, 39, and 42. (B) A representative photomicrograph of the striatum stained for tyrosine hydroxylase on the non-lesioned and lesioned (arrow) sides in mice with 6-OHDA-induced lesions. Scale bar = 2 mm. (C) Quantification of the mean staining intensity for tyrosine hydroxylase (TH) in the dorsolateral striatum on the non-lesioned (non-lesion) and lesioned (lesion) sides. In the Y-axis, the averaged pixel intensities in the measured area were expressed with arbitrary units. Data are means ± SEM (n = 7). Paired two-tailed t-test: ***P < 0.001 vs. non-lesion. (D) Time course of the abnormal involuntary movements (AIMs) scored every 10 min over a period of 180 min after the last levodopa administration in naïve mice and 6-hydroxydopamine (6-OHDA)-lesioned mice. Data are means ± SEM at each time point (naïve mice, n = 10; 6-OHDA-lesioned mice, n = 14). (E) Spontaneous rotations ipsilateral to 6-OHDA-lesioned side percent of total in mice with or without 6-OHDA lesions. 6-OHDA (–) (n = 6); 6-OHDA (+) (n = 6). Data are means ± SEM. **P < 0.01 vs. 6-OHDA (–); Mann-Whitney U-test. (F) Counts of apomorphine-induced contralateral turns per 30 min in mice with or without 6-OHDA lesions. 6-OHDA (–) (n = 6); 6-OHDA (+) (n = 6). Data are means ± SEM. **P < 0.01 vs. naïve controls; Mann-Whitney U-test. (G) Counts of hind limb steps. Steps of the contralateral hind limb as % of the total count in the naïve controls (n = 6) and Hemi-PD mice (n = 6). Data are means ± SEM. *P < 0.05 vs. naïve; Mann-Whitney U-test. (H–K) Schematic representation of the iCBI system, in which the pump and tubing were implanted completely under the skin (H). The infusion cannula implanted into the dopamine-depleted striatum (I), together with the image of striatum after fixation and removal of the cannula (J), and with a Nissl-stained image (K). Scale bars show 0.5 mm in (J) and 100 μm in (K).

